

There are two possible outcomes: if the result confirms the hypothesis, then you’ve made a measurement. If the result is contrary to the hypothesis, then you’ve made a discovery. — Enrico Fermi
Life is wonderful because it is made of discovery. And to me, that is exactly the point of analysis. Analysis is not about confirming the hypothesis you started with. The real pleasure comes when the evidence forces you to change your mind, when the result contradicts what you expected and reveals something you had not seen before.
I have spent my entire professional life analyzing businesses, partly out of passion, partly as a business executive and educator. What has always fascinated me is going beneath the surface to understand the structural patterns that explain what is actually happening. Not merely whether a company beat or missed, whether a stock went up or down, or whether the consensus narrative happened to be right for a quarter. I am interested in what changed underneath: where bargaining power moved, which bottleneck disappeared, which one replaced it, who is financing whom, what is durable, what is temporary, and where the economics of an industry are actually migrating.
That is where analysis becomes discovery. And this is where I stand.
The Map of AI is my most rigorous attempt to track where we actually are in the AI Supercycle. Not where the hype says we are. Not where the skeptics want us to be. But where the underlying system is moving.
Because the real question is structural, and answering it requires more than choosing a side. The AI debate has increasingly collapsed into two analytical shortcuts. One treats the build as largely speculative and economically unjustified. The other treats AI’s transformative potential as sufficient justification for almost any level of spending attached to it. Neither position is analytical. And neither is particularly useful.
They do not tell us whether demand is real, where the bottlenecks sit, which margins come from durable market power and which come from temporary scarcity, how much of the build is financed from internal cash flow versus external capital, whether falling inference costs are compressing economics or expanding usage faster than prices decline, where application-layer rents are forming, or through which financial joints stress would propagate if demand weakened.
I subscribe to neither camp. My job as an analyst is to deconstruct the system. To separate structural change from speculation, infrastructure from narrative, durable economics from temporary scarcity, technological transformation from financial excess, and the failure of one node from the failure of the cycle itself.
The framework has to be capable of holding two ideas at once: a technology can be genuinely transformative while parts of the financing structure around it become overextended. If the evidence moves toward a generalized bubble, the map should show it. If the underlying system continues to strengthen despite local financial failures, the map should show that too.
The objective is not to defend a thesis. It is to keep updating the map as reality changes.
And this quarter changed the map.
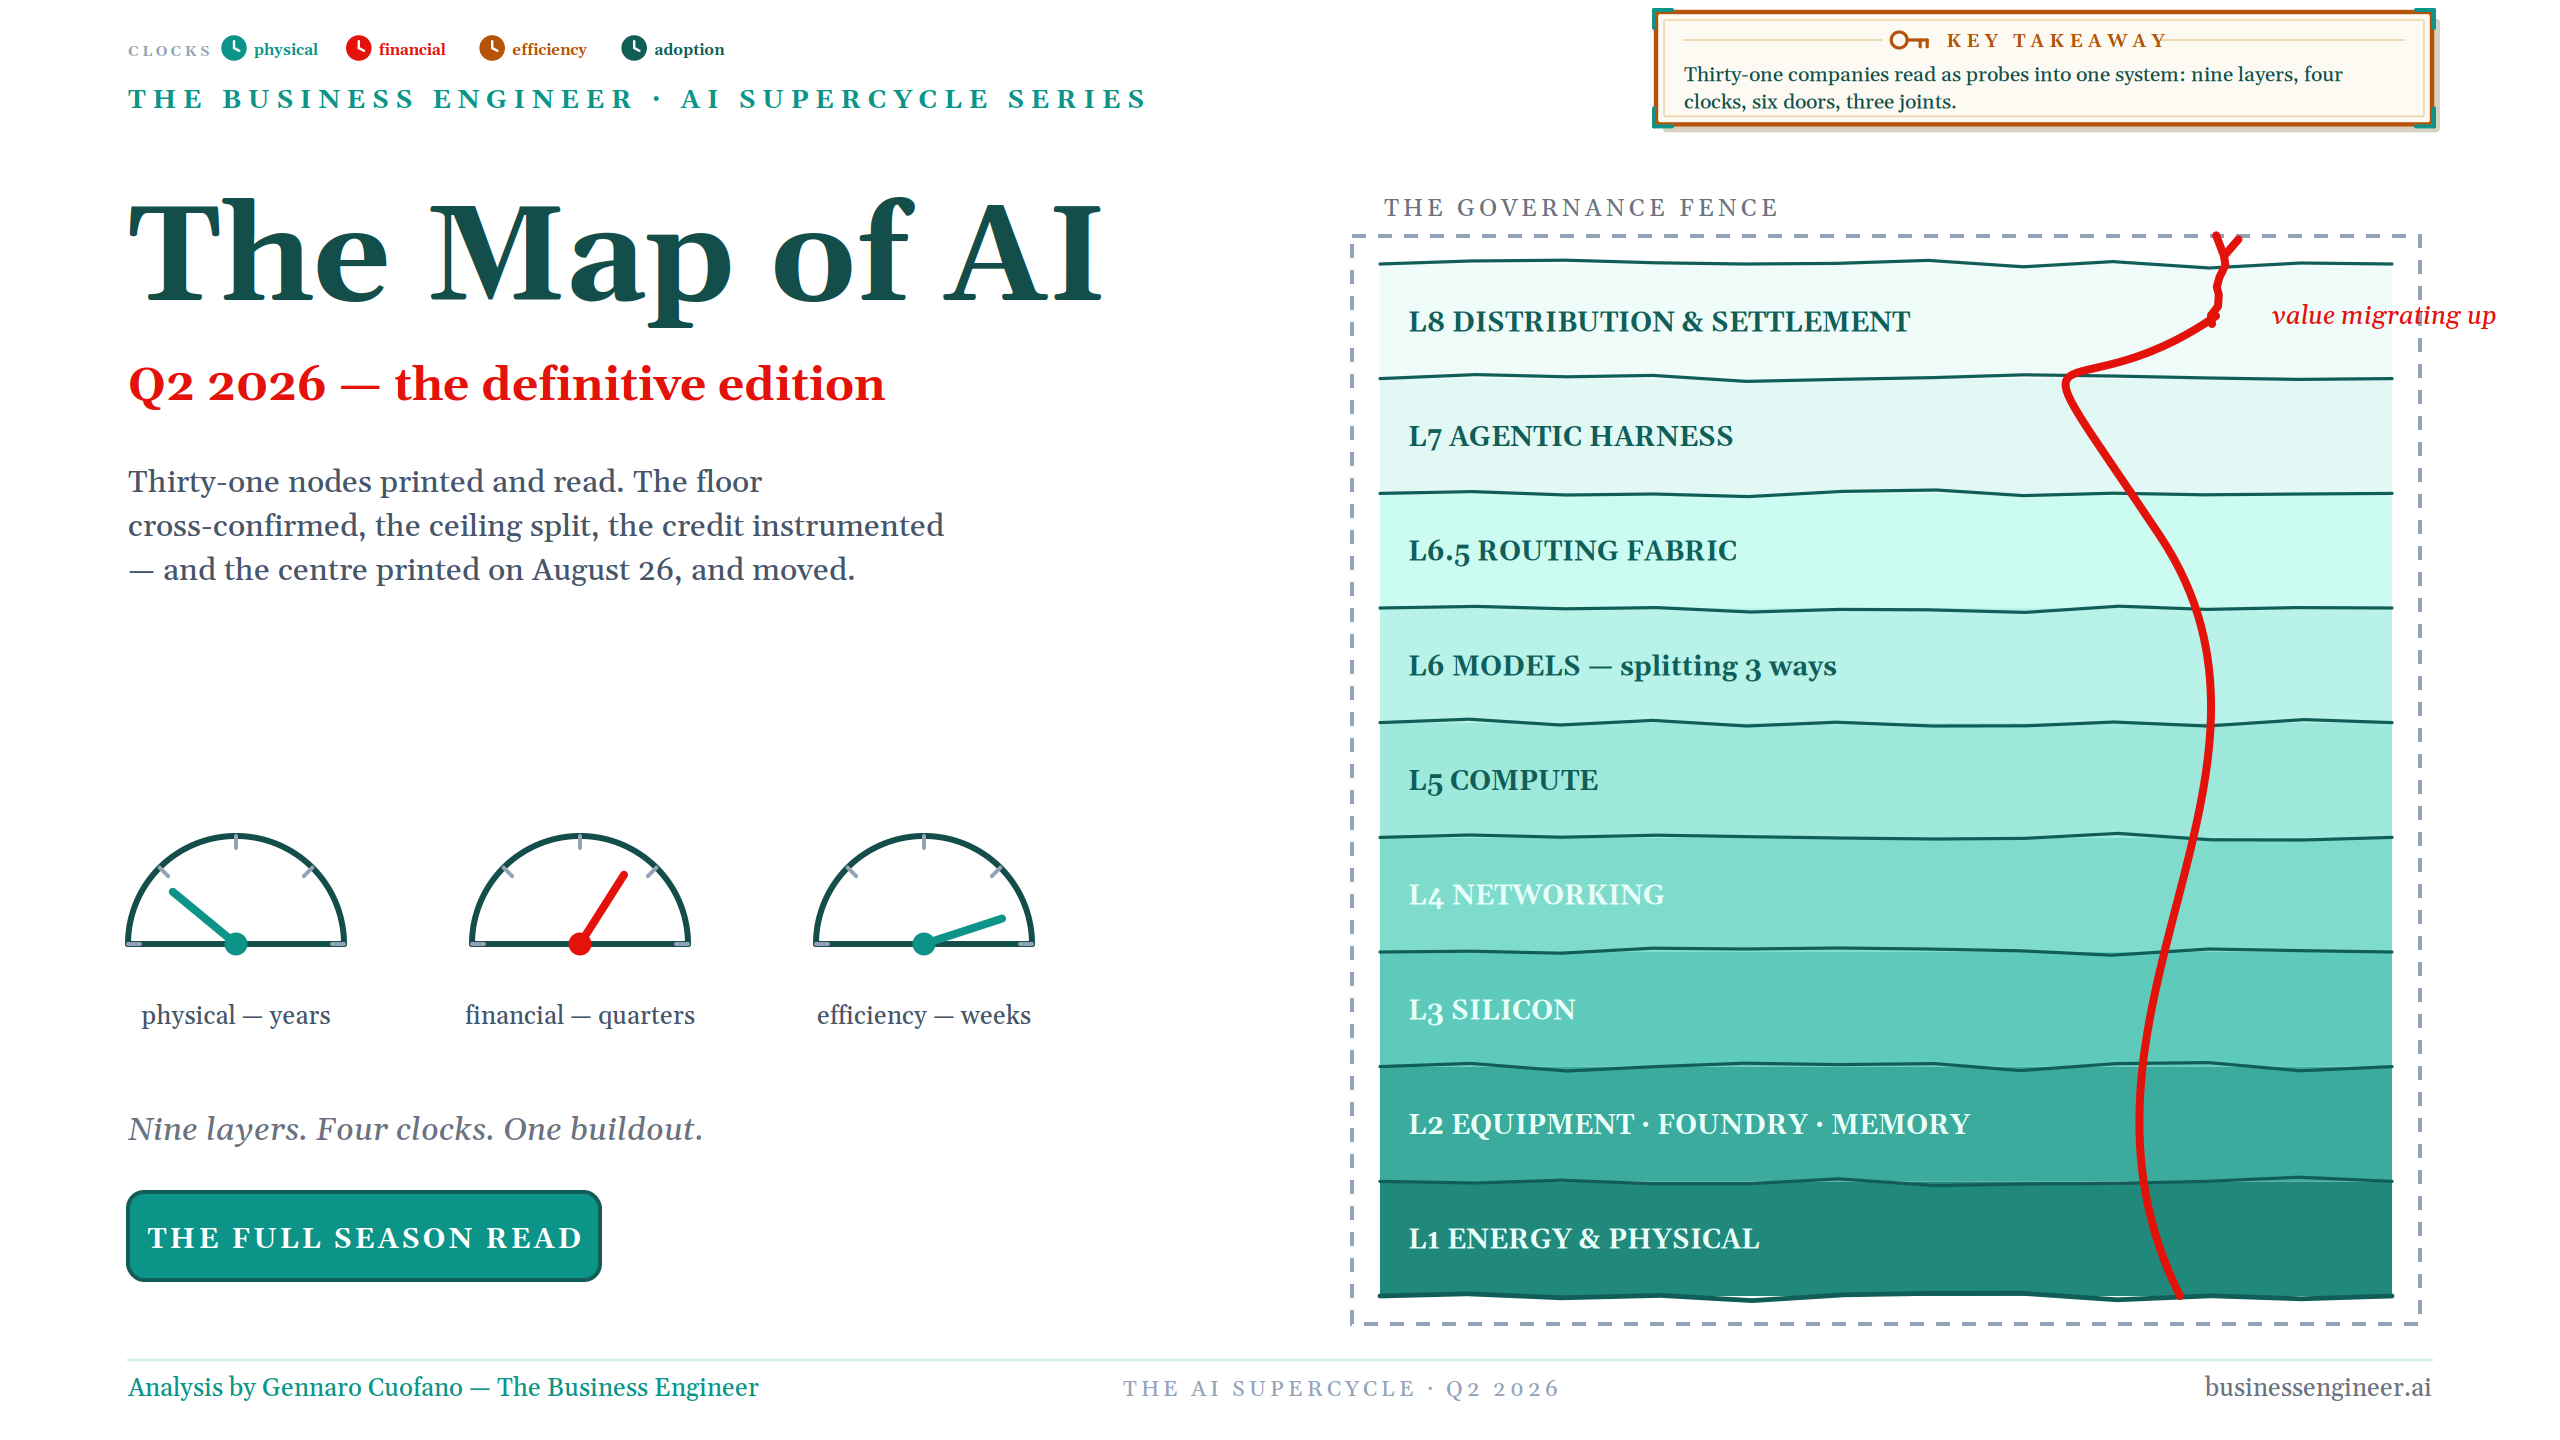
The map is not the territory. It is the instrument.
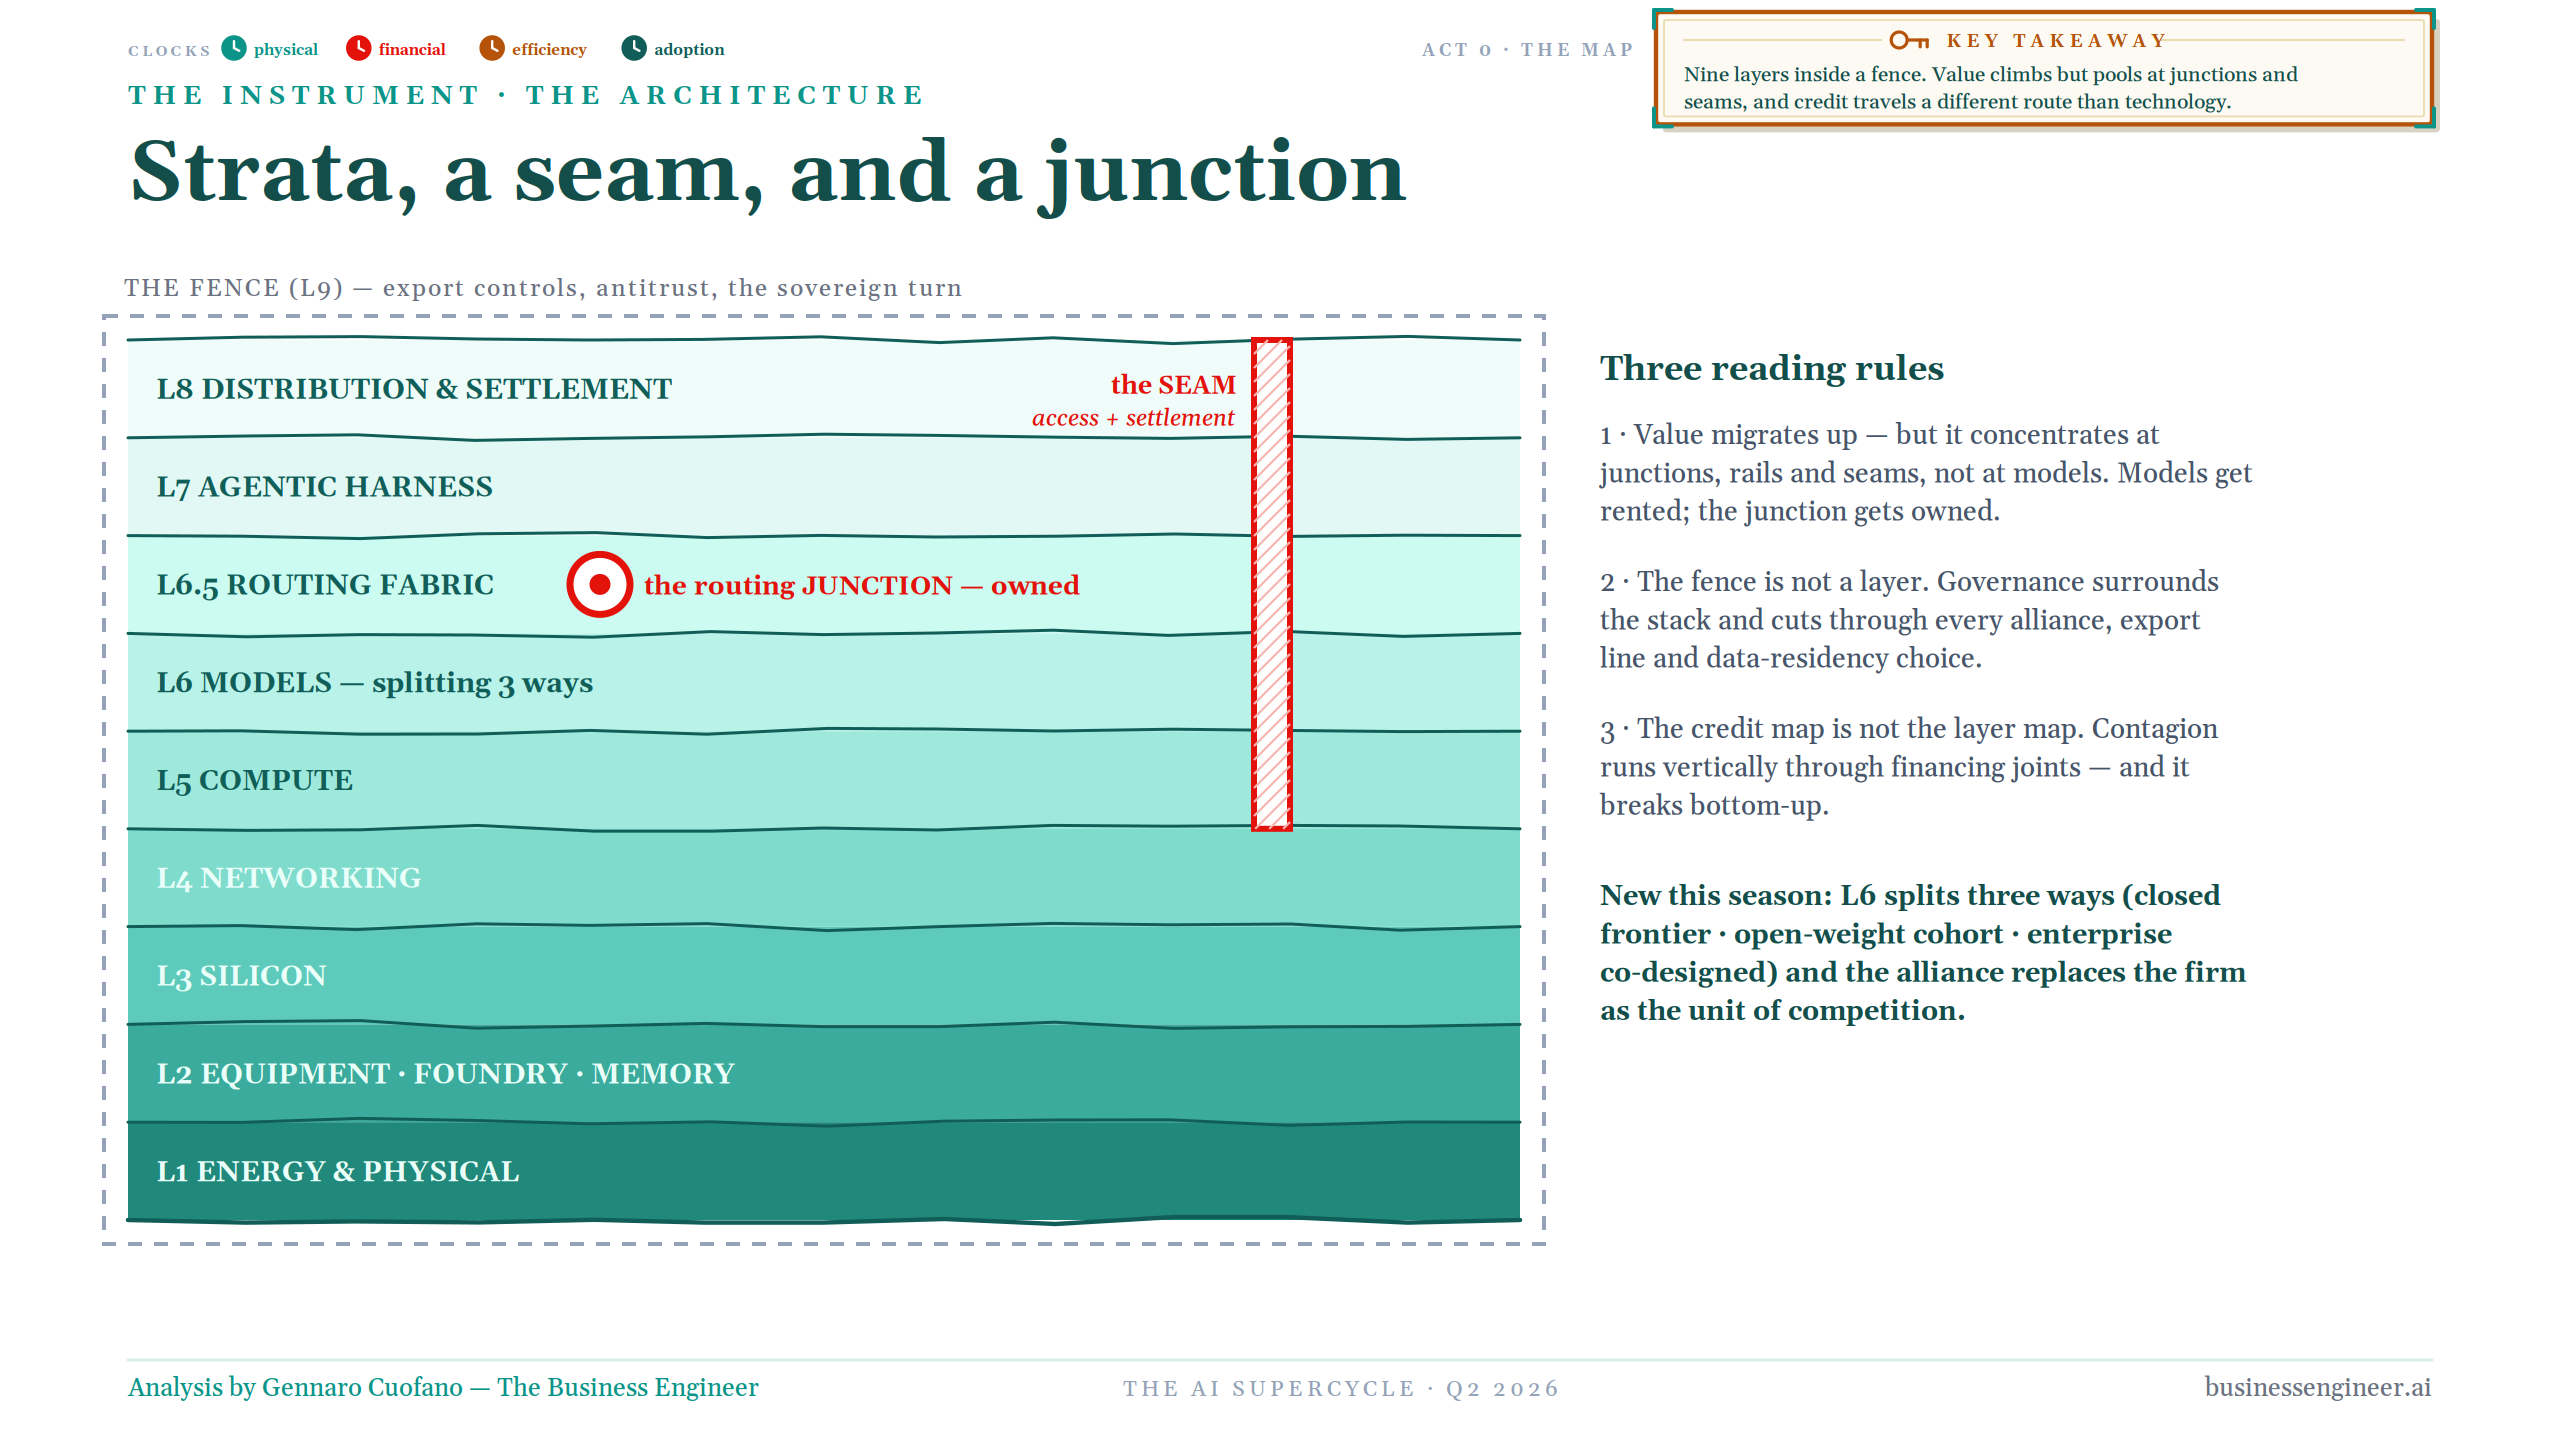
The easiest mistake in analyzing AI is to treat it as a single industry. It is not. The AI Supercycle stretches through nine economic strata, beginning with energy and the physical plant, then equipment, foundry and memory, silicon, networking, compute, models, the routing fabric, the agentic harness, and finally distribution and settlement.
Around that stack sits something that should not be treated as another layer: governance. Export controls, sovereignty, data rules, antitrust, access and industrial policy form a fence around the entire system. They can alter the flow of silicon, capital, models and data without belonging neatly to any one technological layer.
Inside the stack, two structures increasingly matter more than the individual companies printed on it. The first is the seam, where access and settlement concentrate.
The second is the routing junction, where models are selected, enterprise context is held, tools are connected, permissions are enforced, agents are governed and, increasingly, money changes hands. That distinction becomes crucial later because economic power does not necessarily stay with the layer producing the most intelligence. Models can be rented. Junctions can be owned.
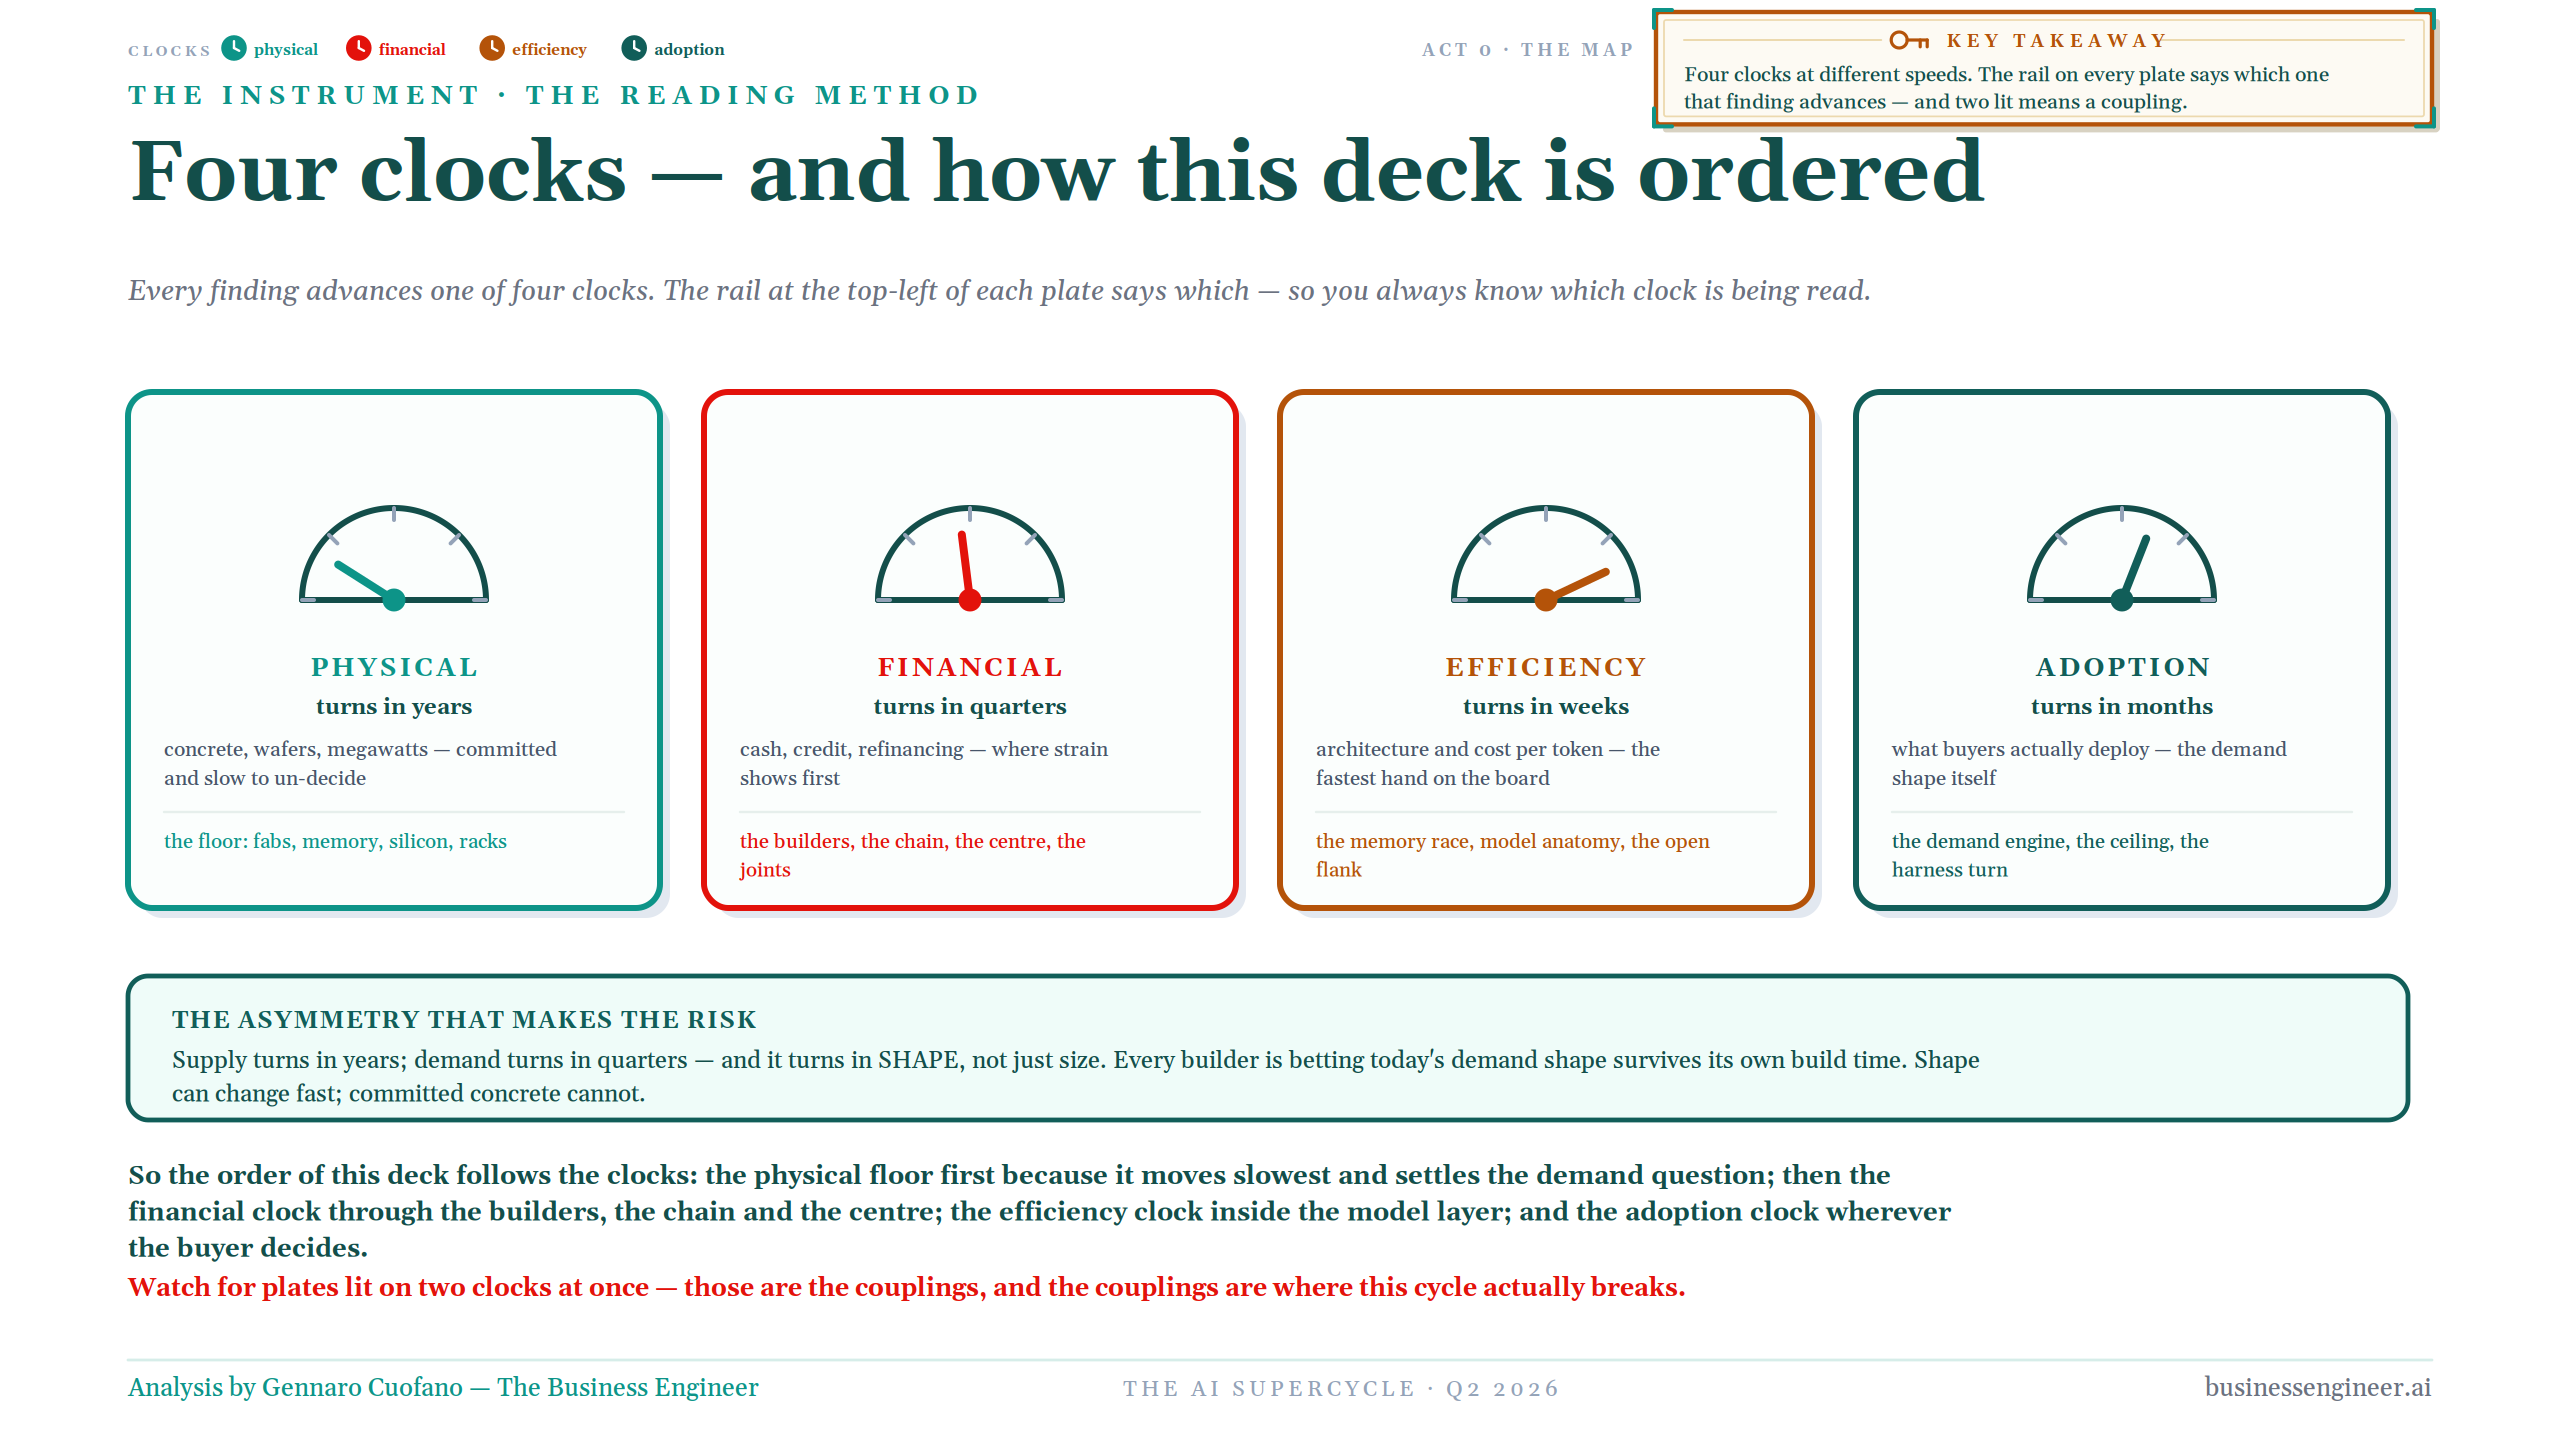
But a layer map alone is still not enough. The system moves on four clocks, and the clocks do not agree. The physical clock turns in years. It measures how binding the actual constraints are through utilization, lead times, contracted versus available capacity and the price of the scarce input. It currently reads 78/100. The financial clock turns in quarters. It measures how much strain has migrated into debt, off-balance-sheet structures, receivables, vendor finance and the broader funding architecture. It reads 64/100.
The efficiency clock turns in weeks. It measures how quickly the cost per unit of capability is falling through model architecture, active-parameter ratios and the amount of intelligence bought per dollar. It is the hottest clock at 82/100. The adoption clock turns in months. It measures how far real deployment has actually gone: countable revenue against the hurdle, contracted agentic value, deployments per quarter and the migration from seats toward actions. It remains the youngest at 31/100.
These are directional indicators, not one common risk scale. A high efficiency reading means capability is becoming cheaper quickly. A high financial reading means funding strain is increasing. What matters is how the clocks interact.
That gives us one of the central asymmetries of the entire cycle. Physical supply turns in years. Financial conditions turn in quarters. Efficiency can reprice in weeks. Adoption happens somewhere in between. Any company building physical capacity today is betting that the demand shape visible now survives for the years required to deliver that capacity, even though the technology consuming it can change in weeks.
There is then a second instrument focused specifically on the financing of the build. Six gauges ask different versions of the same question: how much of what has already been promised can operating cash cover; how much demand is genuinely contracted; how dependent the build is on external capital; how much short-duration money is financing long-duration assets; how much of the structure sits in vehicles rather than directly on balance sheets; and how fast that funding mix is changing.
Many curves, one climb
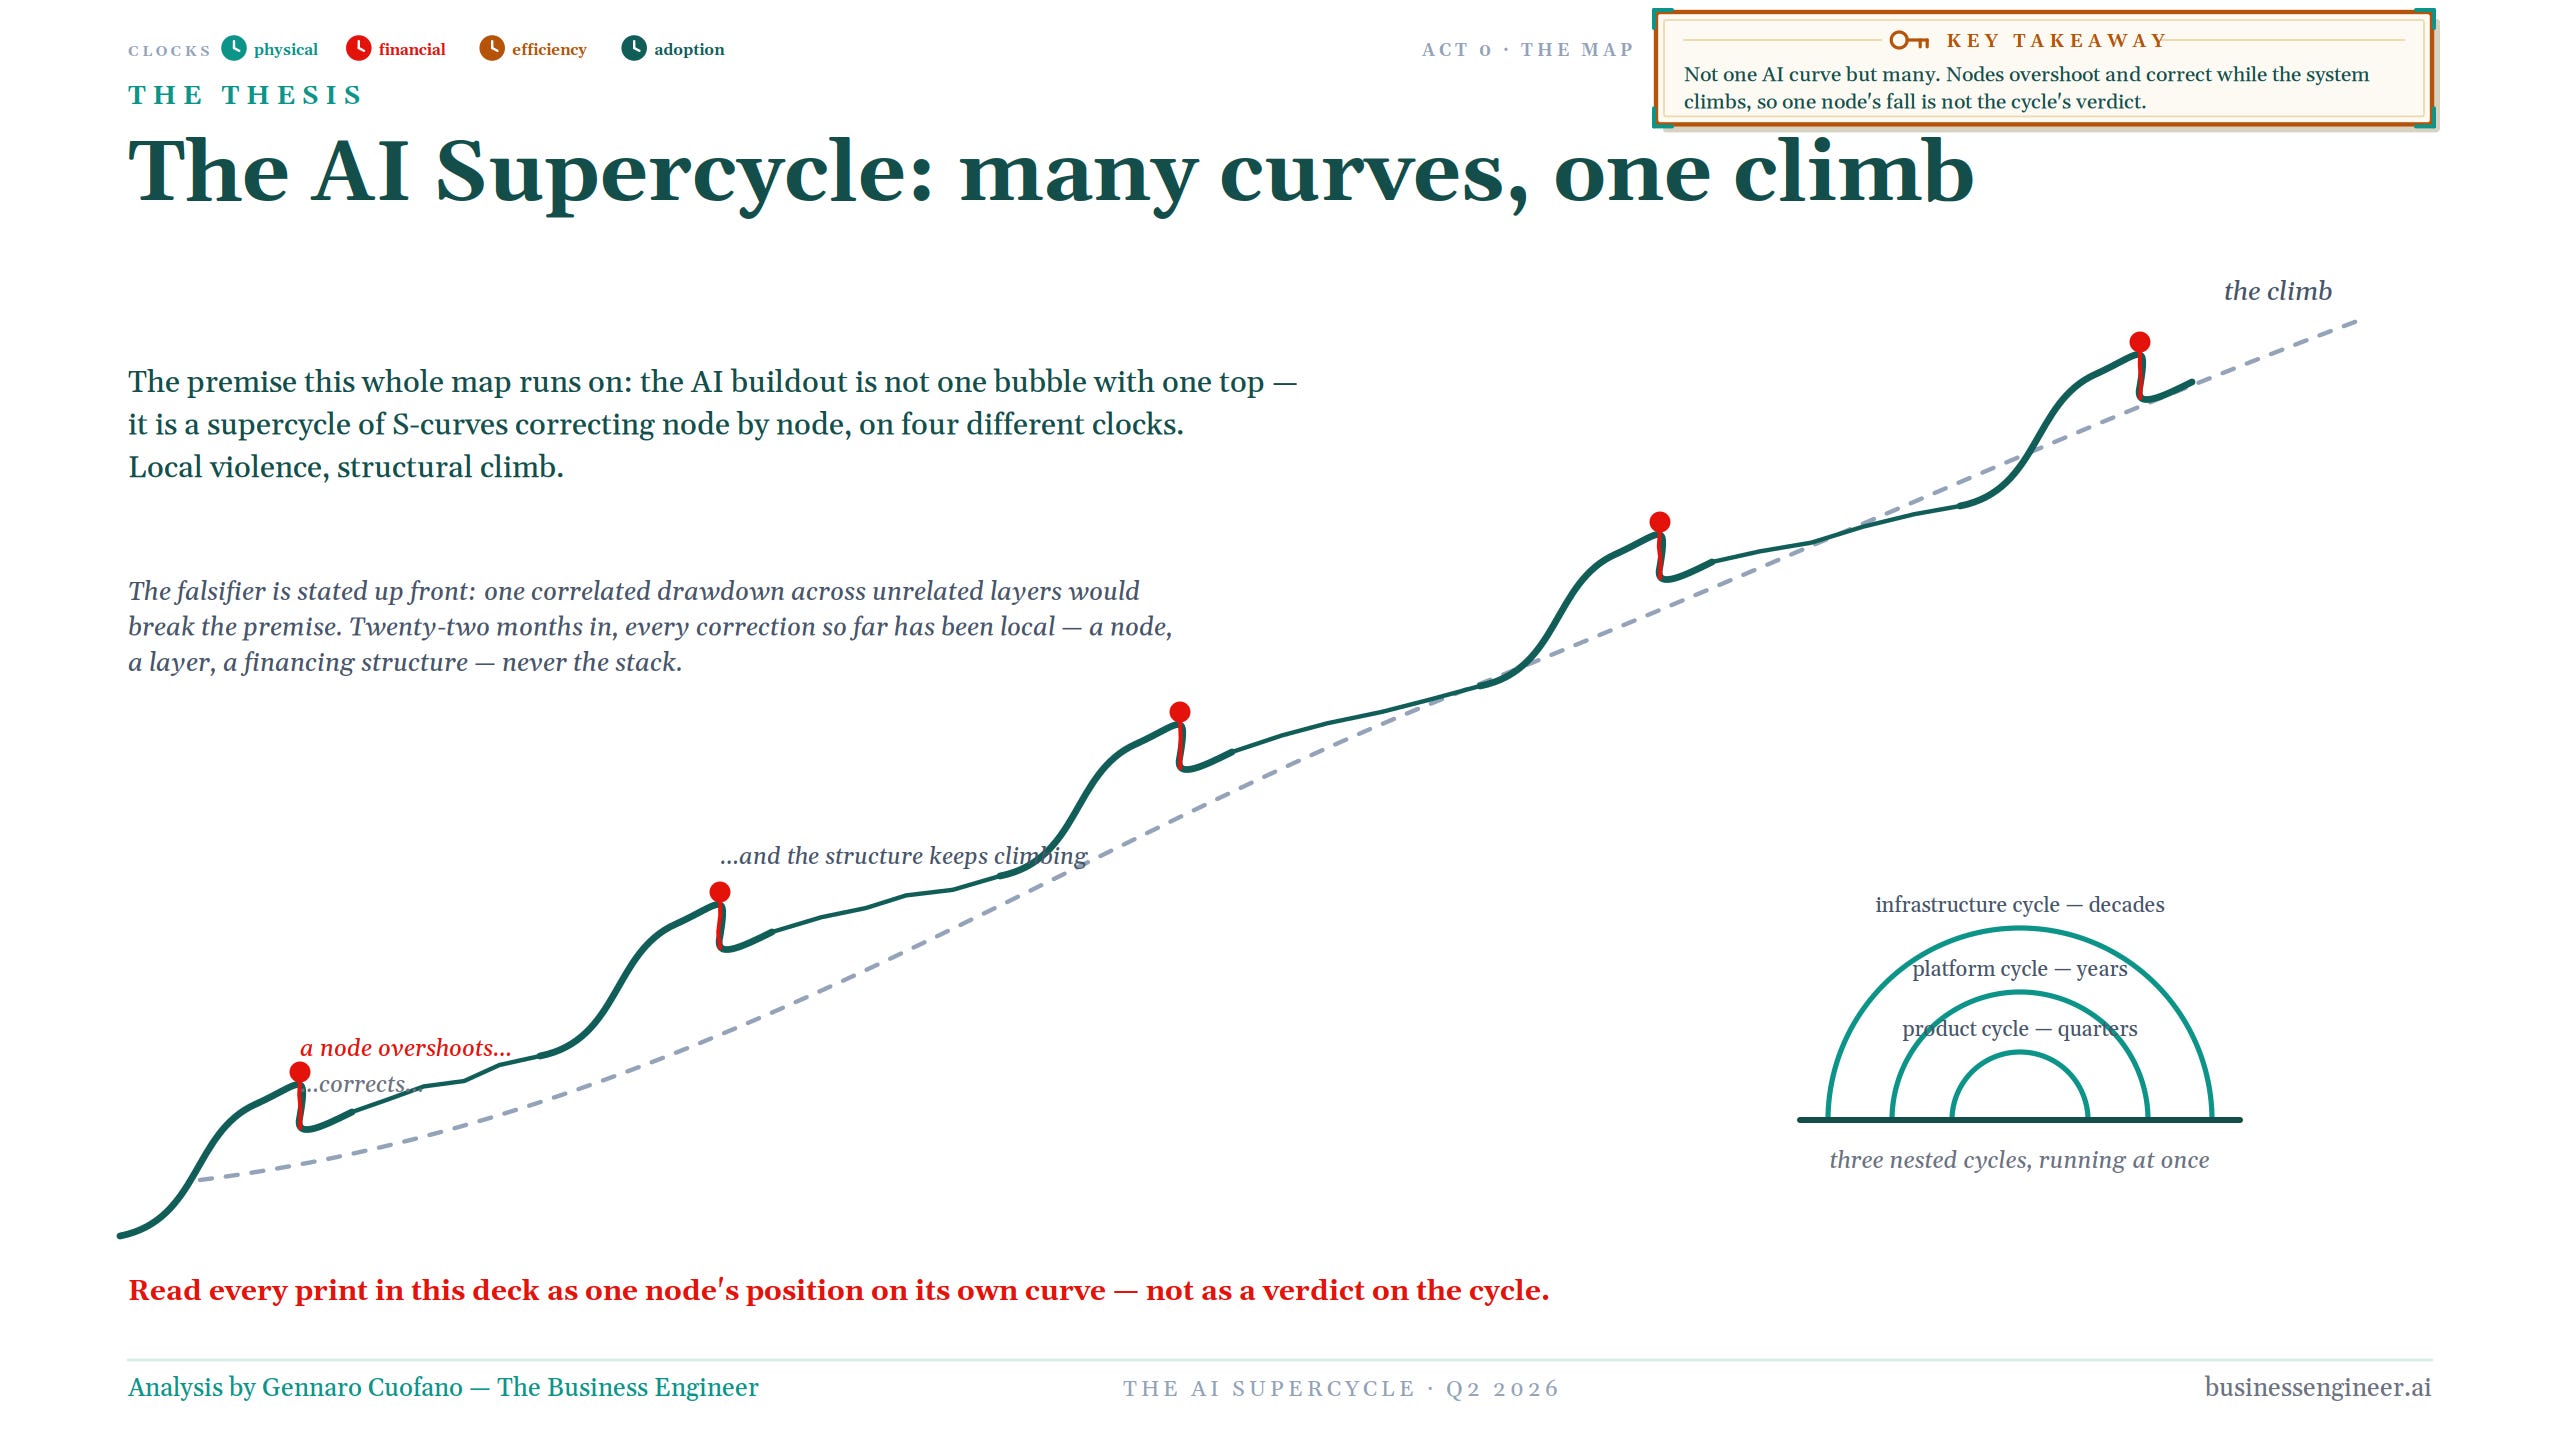
This leads to the premise underneath the entire map. There is no single AI curve. There are product cycles that move in quarters, platform cycles that move in years and infrastructure cycles that can stretch across decades. Inside them sit individual companies and technologies, each on its own S-curve.
A node can overshoot and correct while the larger structure keeps climbing. A model company can lose pricing power while application adoption accelerates. A neocloud can refinance under pressure while ASML and TSMC continue seeing the same underlying physical demand. Memory prices can rise while inference prices fall. A builder can become financially stressed even as the infrastructure it owns remains strategically valuable.
That is why I resist the phrase “the AI bubble” in the singular. The falsifier is much more demanding. If unrelated layers began drawing down together across technology, demand and capital, the supercycle thesis itself would have to be reconsidered. But after more than twenty months of corrections, the failures we have seen remain predominantly local: a node, a layer, a funding structure.
Local violence. Structural climb.
Read every company print in this analysis as one node’s position on its own curve, not as a verdict on the entire cycle.
1846: the railway mania is the right rhyme
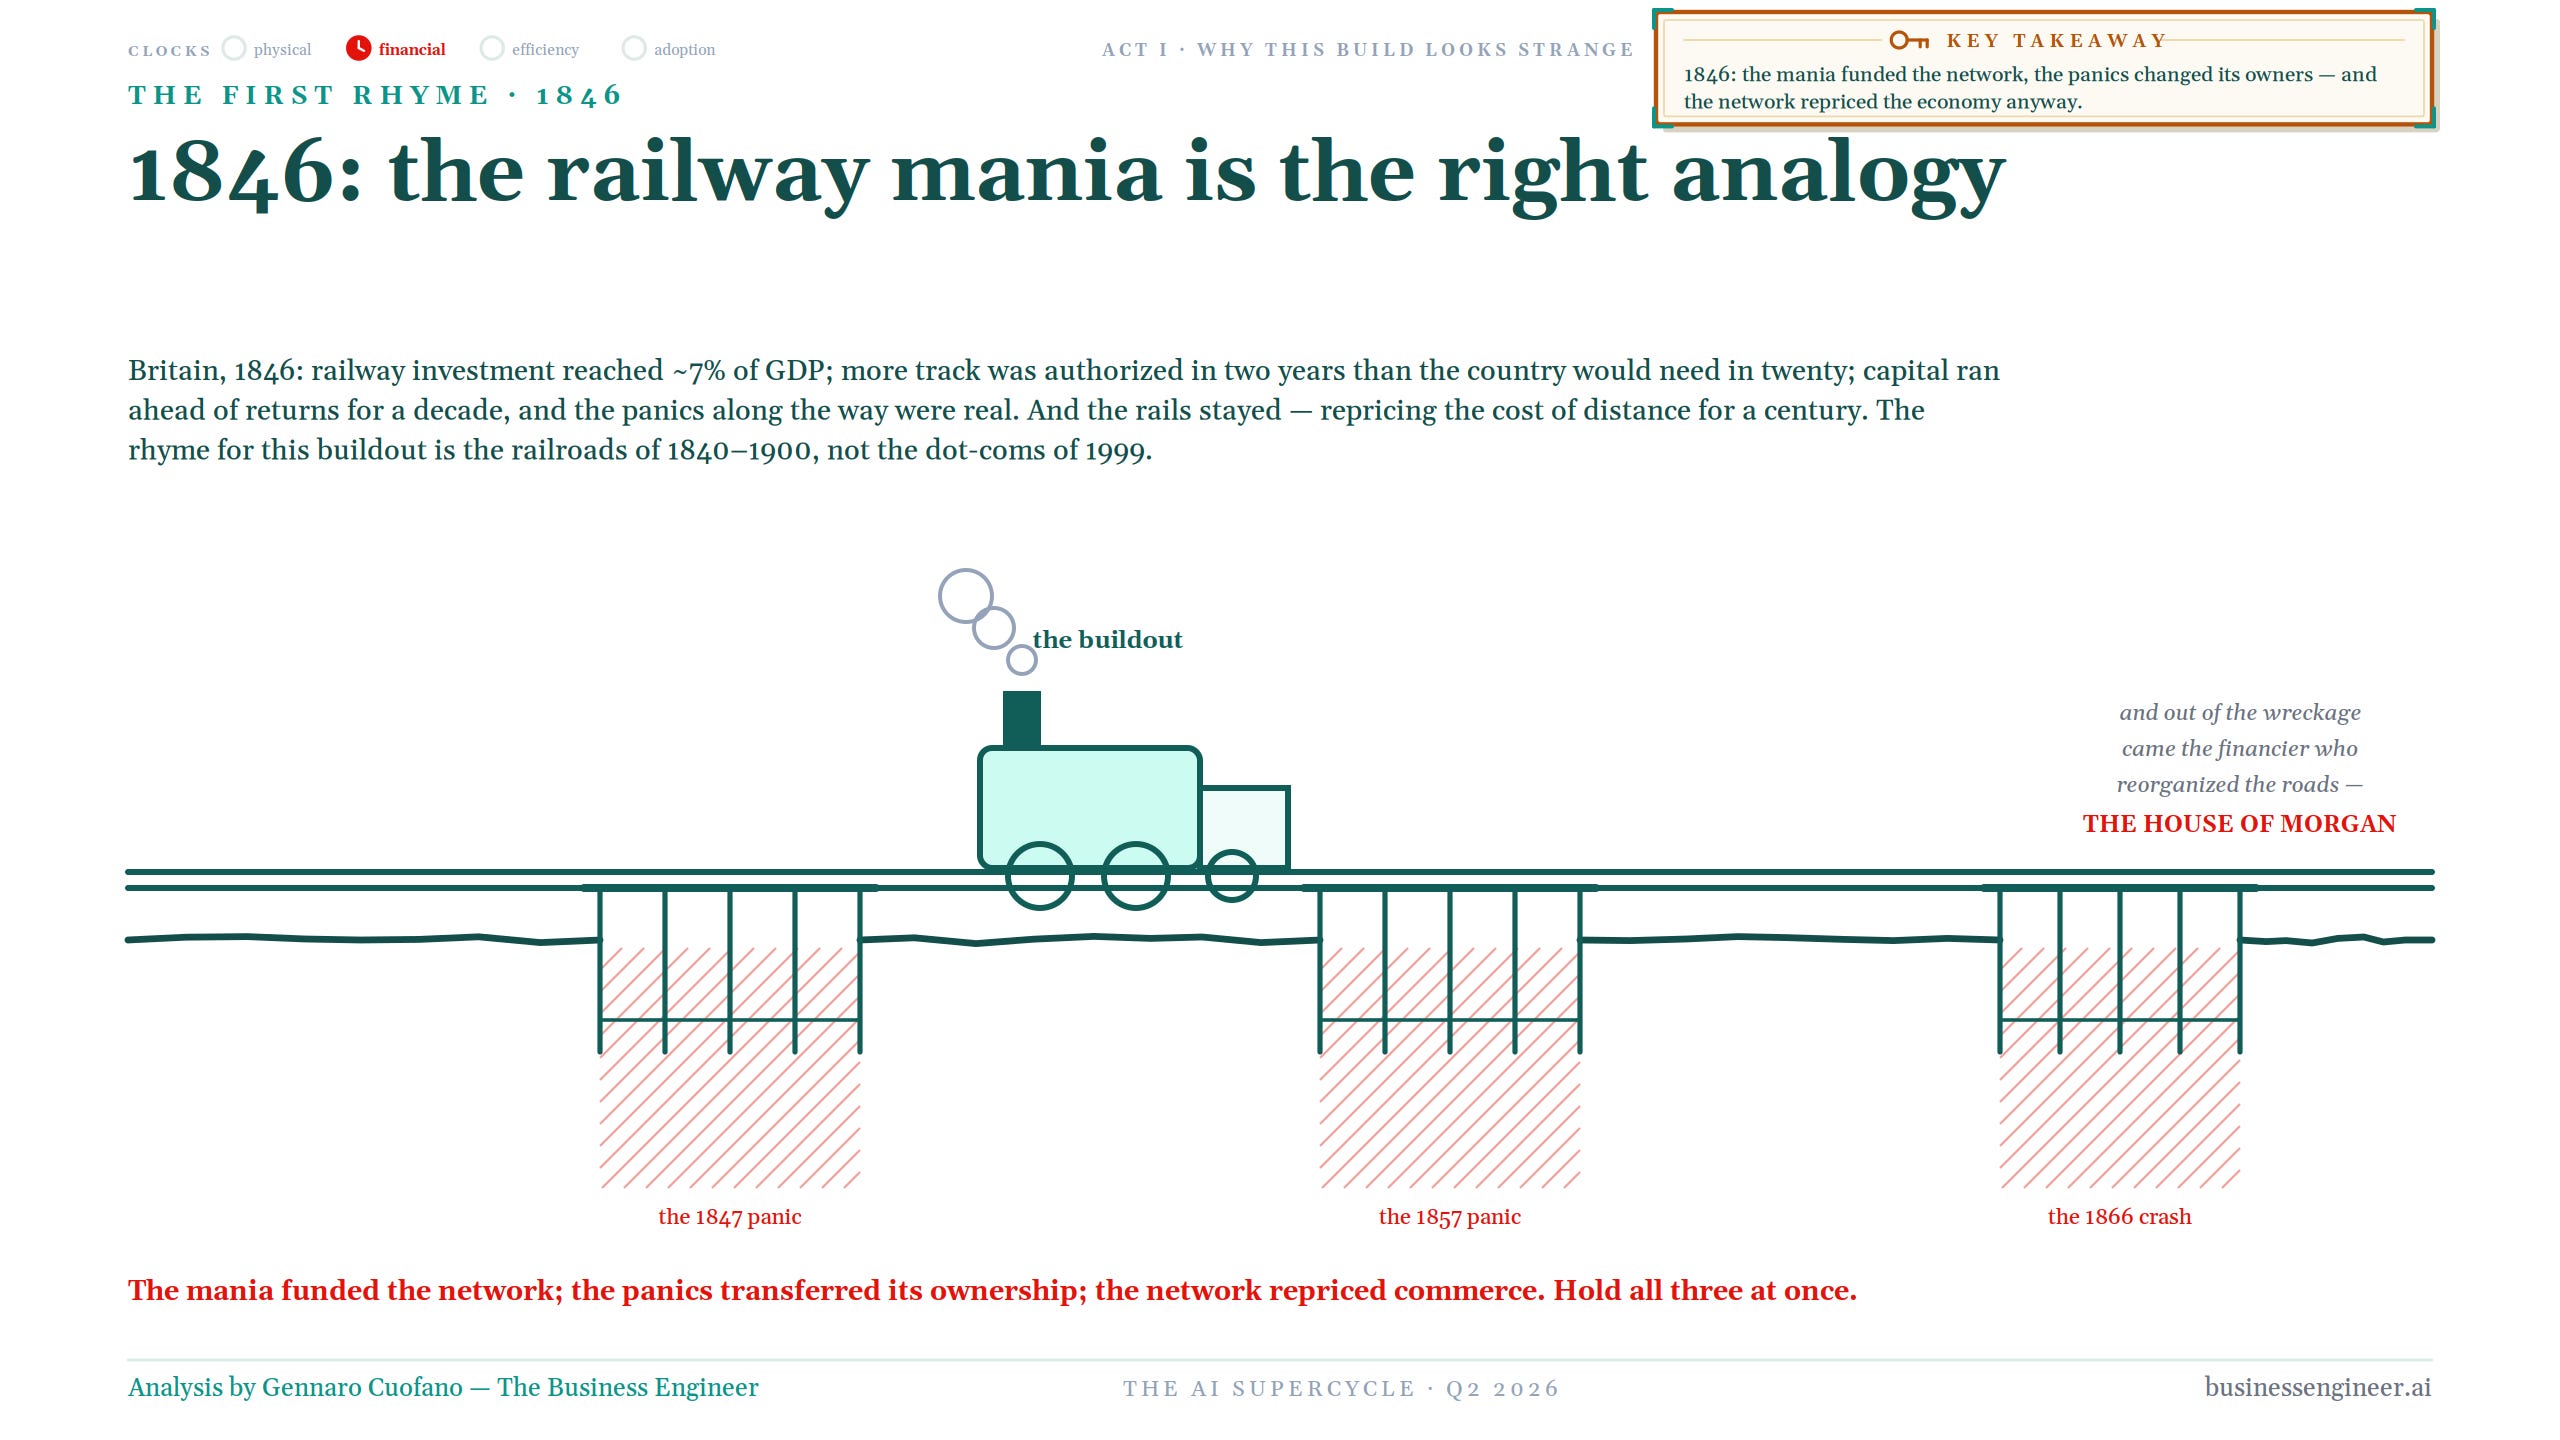
This is where history becomes useful, not as decoration, but as a way to separate variables. For most of the AI boom, the lazy analogy has been the dot-com era. The comparison is not useless. Transformative technologies can obviously be catastrophically mispriced. The internet survived 2000. Many of the financial claims written around it did not.
But AI is no longer primarily a software valuation story. It is a physical infrastructure story. That is why 1846 and the British railway mania increasingly look like the more useful frame.
At the peak, British railway investment approached roughly 7% of GDP. More track was authorized in a tiny window than the country would need for years. Capital ran far ahead of realized returns. Promoters oversold. Investors speculated. The panics of 1847 and 1857 came, and the crash of 1866 followed. The losses were real. And the railway stayed. It repriced the cost of distance for a century.
That is the part of the analogy worth holding onto. The mania funded the network. The panics transferred its ownership. The network repriced commerce anyway. An infrastructure supercycle does not require the original financiers to survive. The assets can outlive the capital structure that created them.
And out of the wreckage of that railway era emerged institutions that reorganized and refinanced the network. One of them was the House of Morgan. Keep that detail. It will matter again at the center of this map.
1947: the control experiment
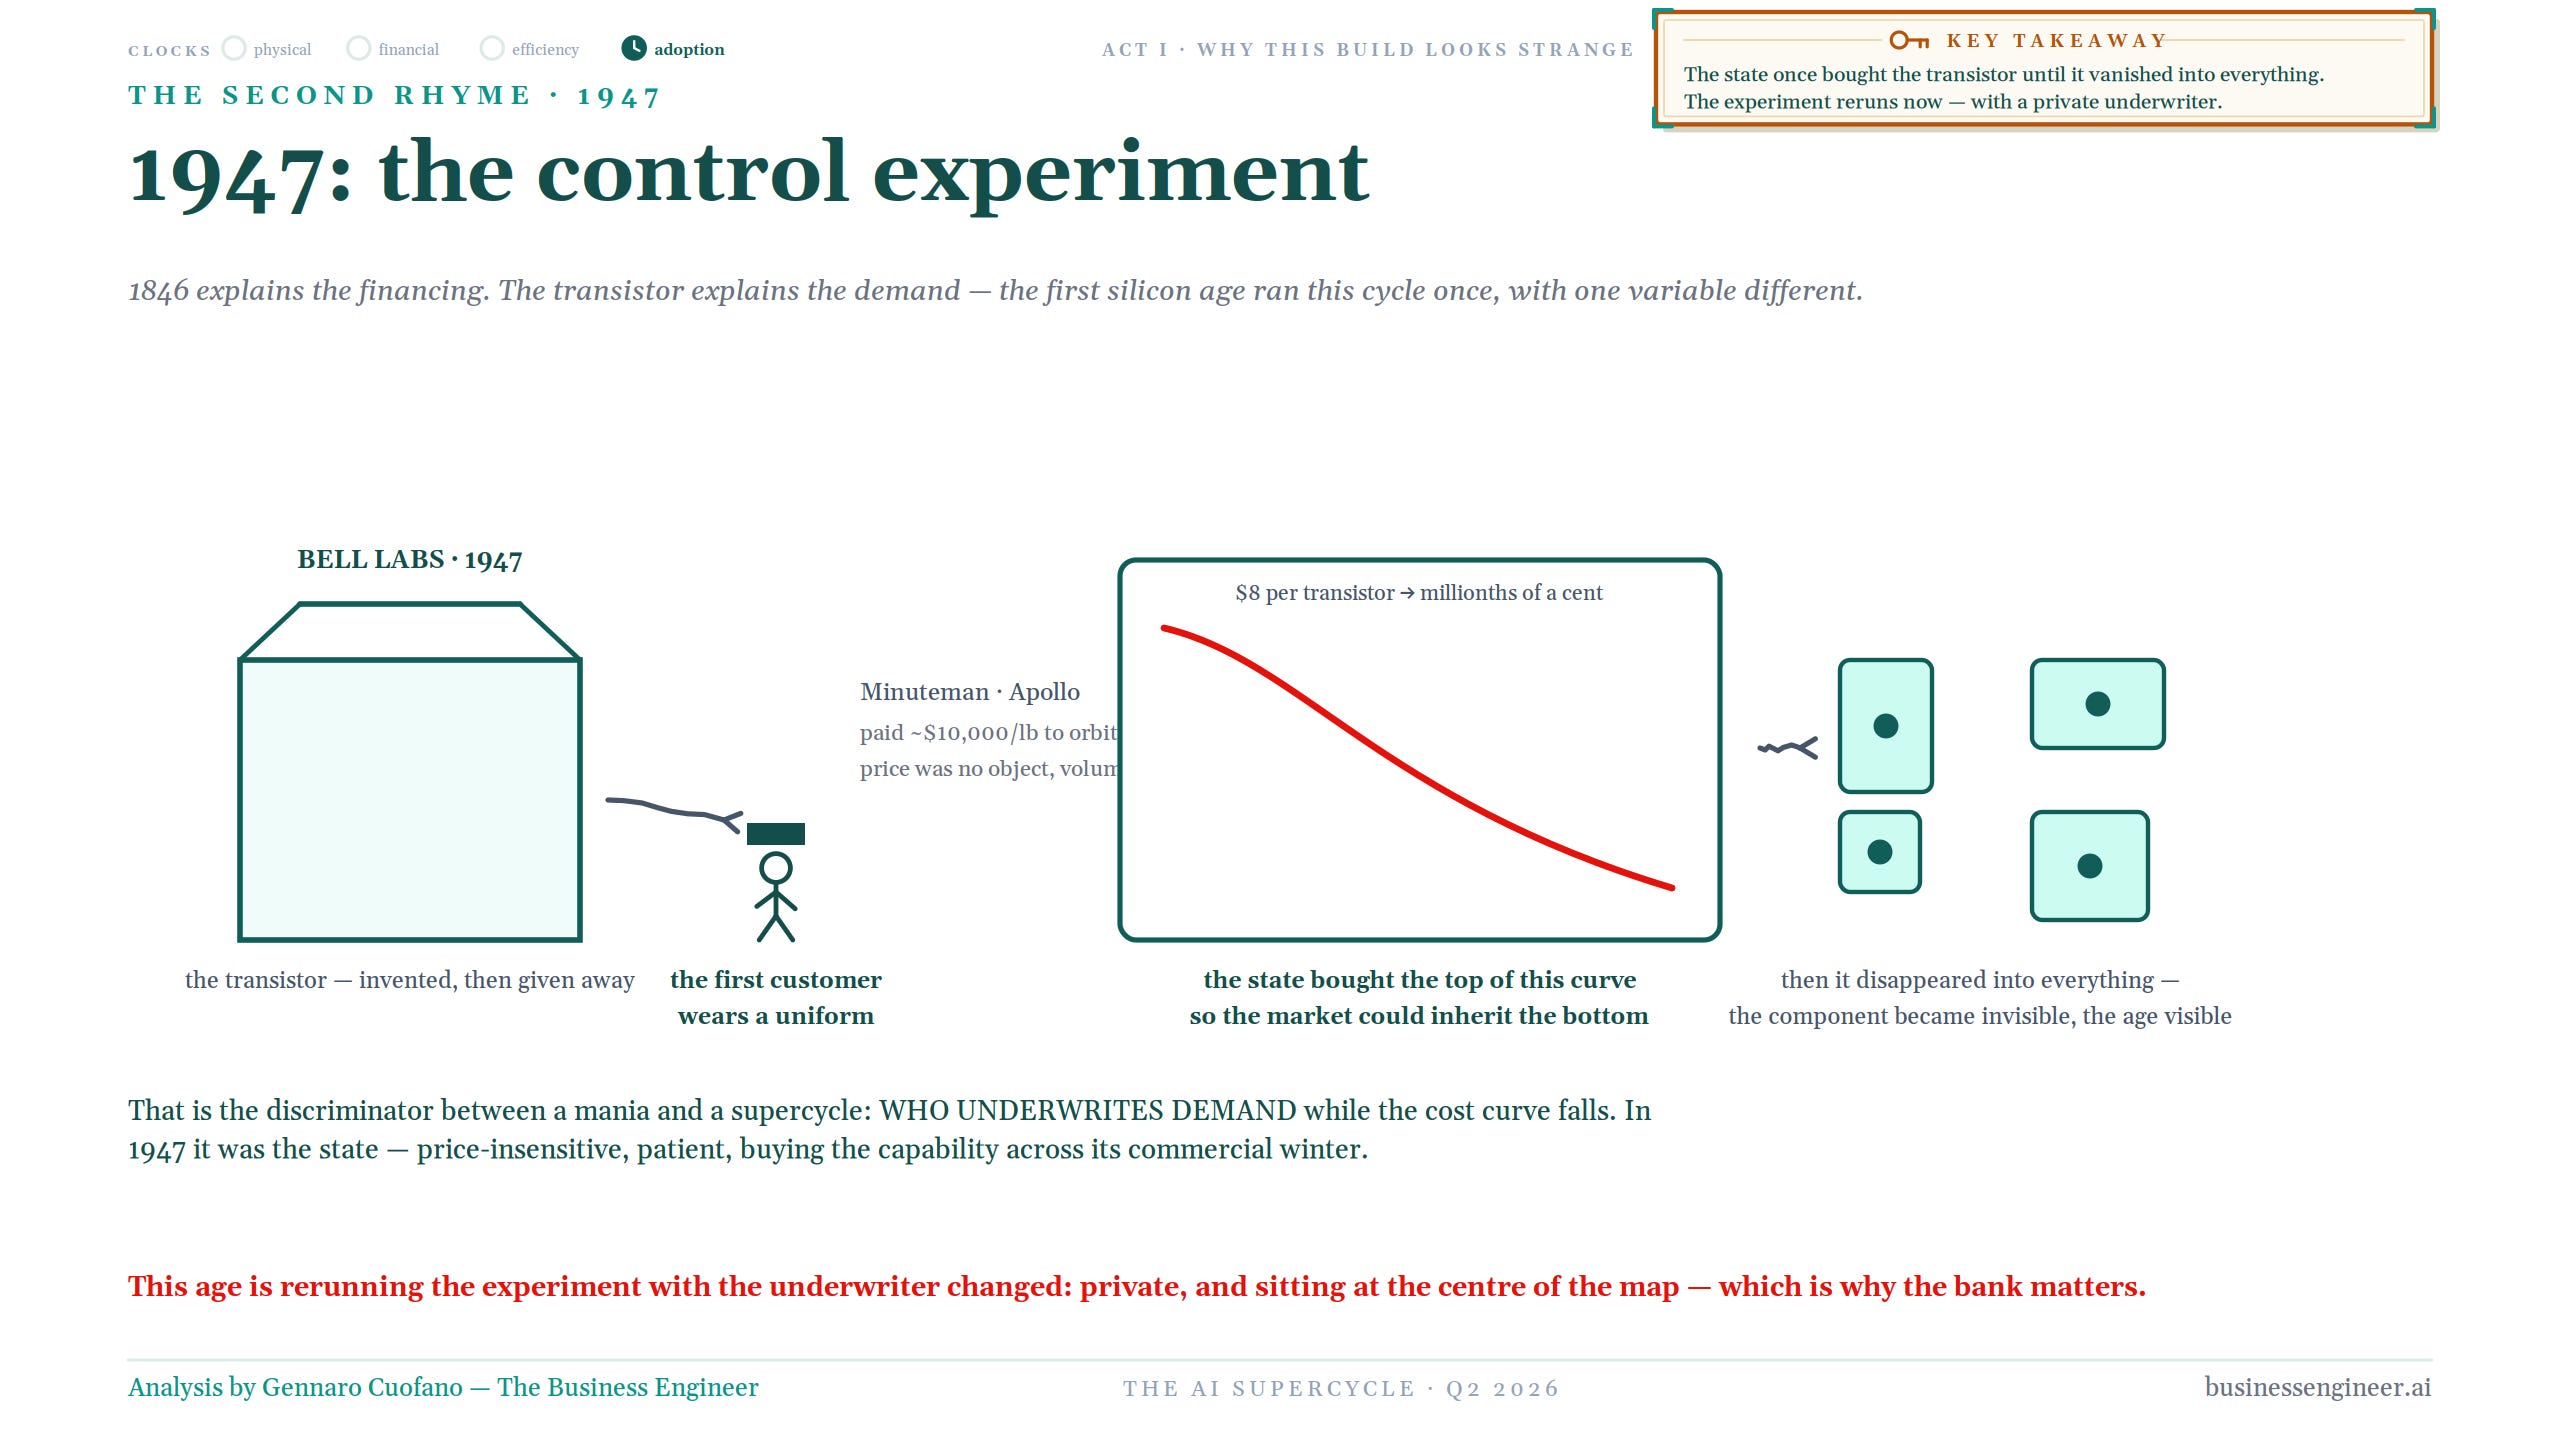
The railway explains the financing. But it does not explain what happens when the cost of the underlying technology collapses. For that we need another historical rhyme: 1947 and the transistor.
The transistor began as an expensive, barely commercial component. Then its cost fell from dollars per unit toward fractions of a cent and eventually disappeared into virtually everything. But the early cost curve had an underwriter. The first customer wore a uniform.
The US state could buy the top of the curve through programs such as Minuteman and Apollo because price was not the primary constraint. Capability was. The state was patient, strategic and relatively insensitive to the economics that would have stopped a purely commercial buyer.
That is the control experiment. The technology became cheaper. Demand expanded. Eventually the component became invisible because it was embedded everywhere. The interesting variable is not simply that the cost curve falls. It is who underwrites demand while it falls.
In the first silicon age, much of that underwriting was public. This time, the experiment is being rerun with a different underwriter. The underwriter is increasingly private, and it sits inside the map.
That is why the financing architecture matters so much.
Two stacks, one fence, three buyers
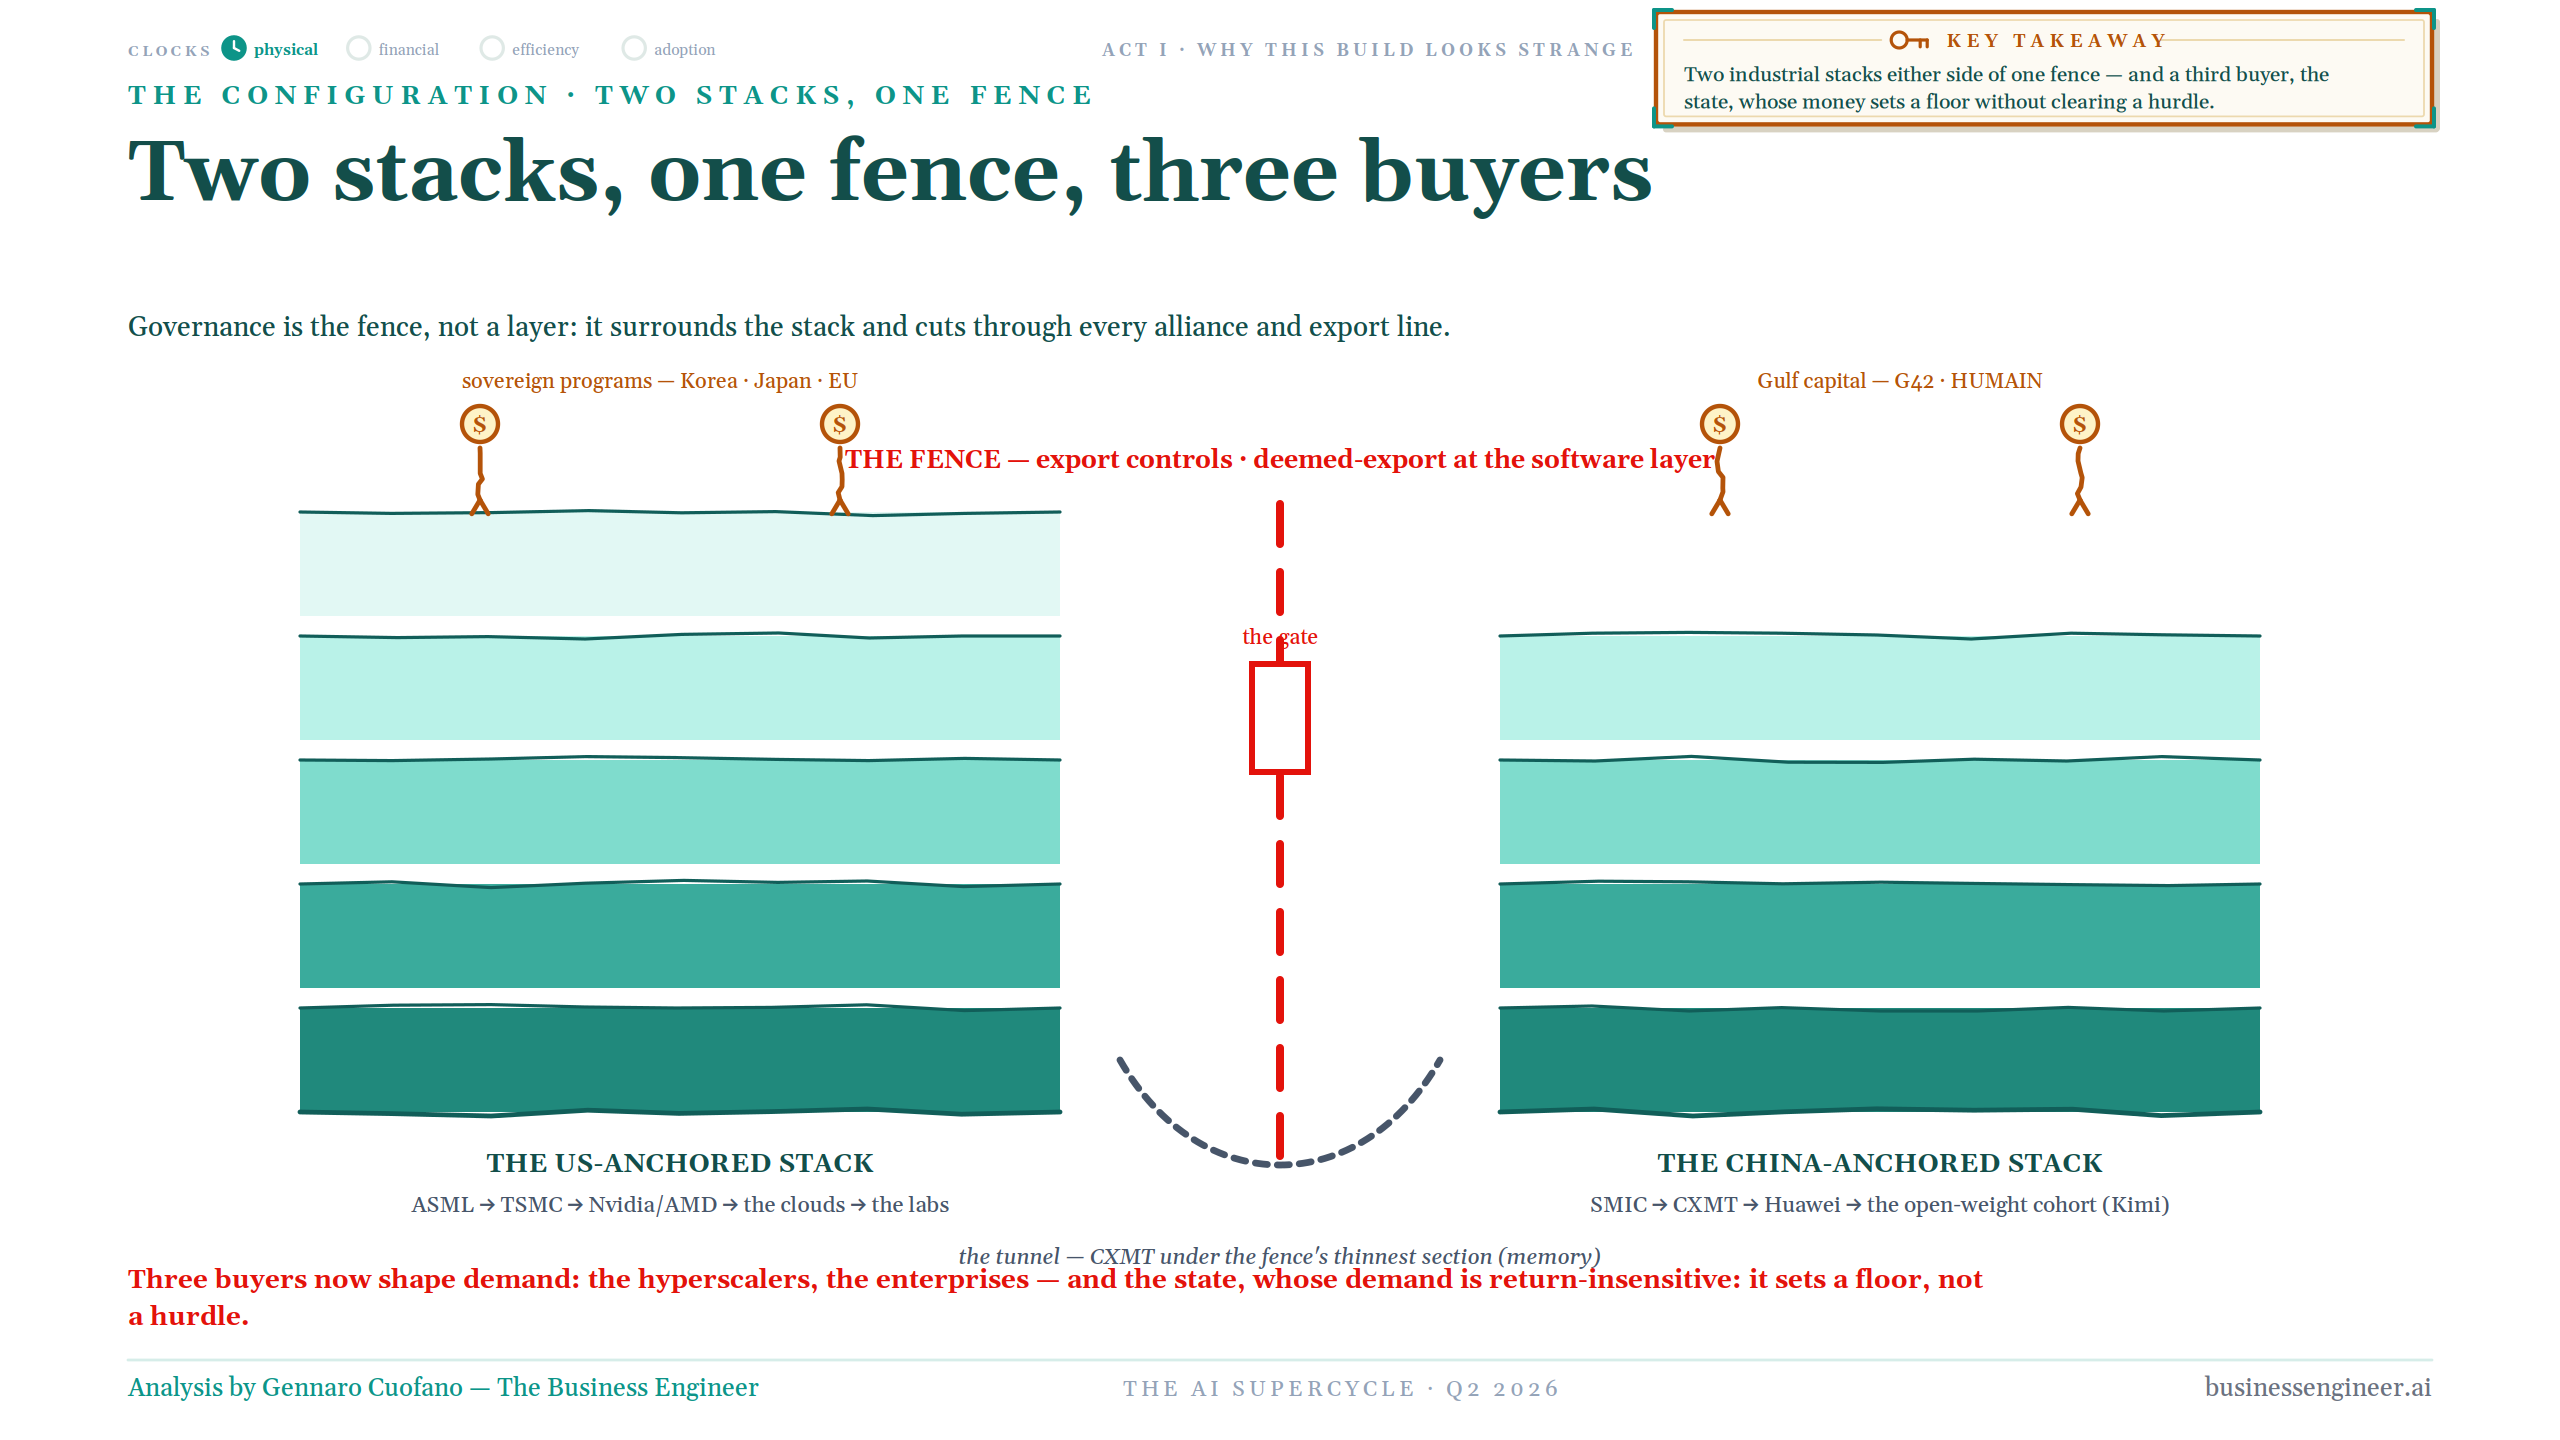
There is another difference from previous technology cycles: AI is no longer developing as a single global industrial stack. The US-anchored stack runs broadly through the leading equipment makers, TSMC, NVIDIA and AMD, the hyperscalers and the frontier labs. The China-anchored stack increasingly runs through SMIC, CXMT, Huawei and a powerful open-weight ecosystem of its own.
Between them sits the governance fence. But the demand side is also changing. There are now three buyers.
The first is the hyperscaler. It can build ahead of perfectly observable demand because compute capacity itself is strategic. Losing access to the infrastructure can be more dangerous than temporarily earning a poor return on it.
The second is the enterprise. This buyer is much more economically disciplined. It buys when AI changes a workflow, reduces cost, creates revenue or becomes sufficiently embedded in operations to justify the transition.
The third is the state. And the state can be return-insensitive. Sovereign AI programs can keep buying strategic compute even when the conventional corporate return equation weakens. This gives the physical floor an important new support.
But it is essential not to confuse two things. The state can set a floor. It cannot clear the commercial hurdle for the rest of the system.
Why compute demand has this shape
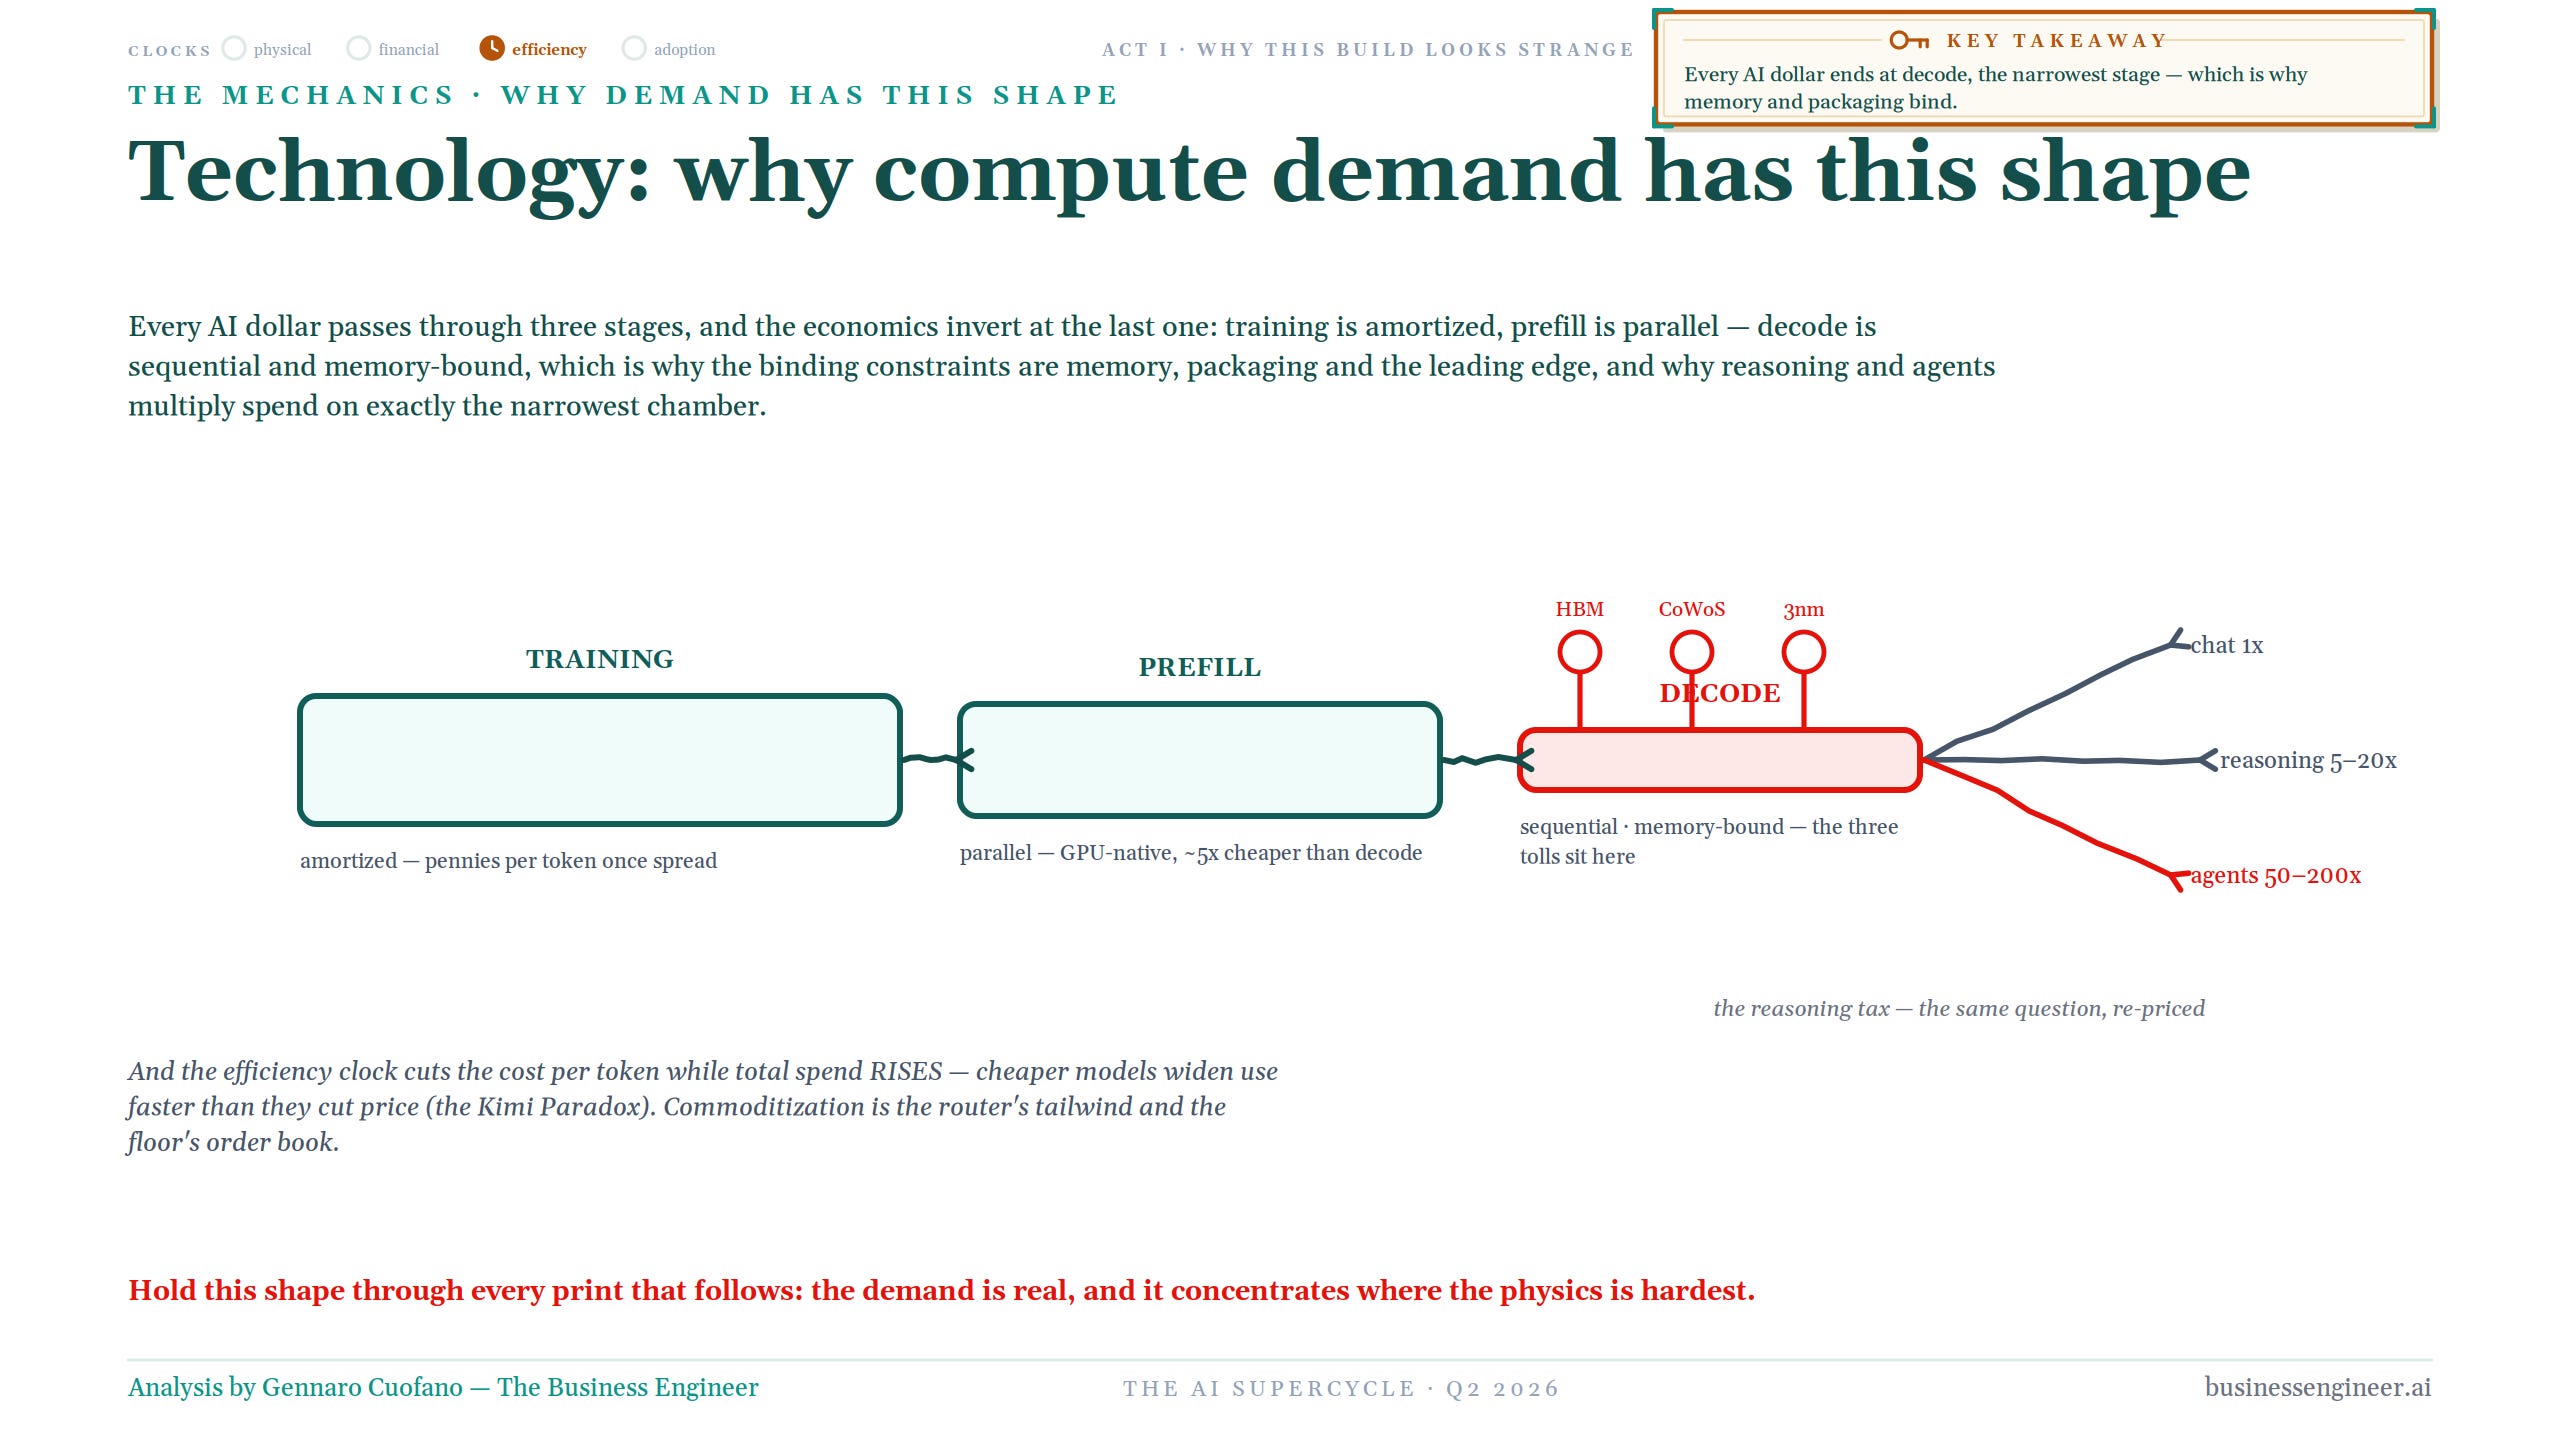
The next piece of the map is mechanical. Every AI dollar ultimately passes through three stages: training, prefill and decode.
Training is enormously expensive, but its cost can be spread over vast quantities of future usage. Prefill is highly parallel and comparatively well matched to GPU architectures. Decode is different. It is sequential, heavily memory-bound and therefore pushes directly against HBM, advanced packaging and leading-edge process capacity.
And then reasoning changes the amount of work. A basic chat interaction can represent roughly one unit of compute. A reasoning workload can require 5–20 times more. An agentic workflow can move toward 50–200 times because the system loops, calls tools, invokes subagents, retrieves memory, evaluates intermediate outputs and keeps working without waiting for the human to prompt it again.
This is why the efficiency argument is so easy to misunderstand. Yes, models get cheaper. But cheaper models create more usage. This is the Kimi Paradox: the efficiency clock cuts the cost per token while total spend rises because cheaper intelligence expands consumption faster than it reduces unit price.
And the most compute-intensive new use cases happen to concentrate demand exactly where the physical system is hardest to scale. Commoditization is simultaneously the router’s tailwind and the physical floor’s order book.
The buyer behind all of this is increasingly visible. Three closed labs alone represent roughly 58% of countable AI revenue in the framework. The labs take about a third of each year’s incremental compute capacity, heading toward half, and a remarkable portion of their compute is still pointed inward at research rather than external customers.
They monetize through four different spigots: API tokens, consumer subscriptions, enterprise and agentic contracts, and cloud reseller rails. Yet the engine also has to finance its own successor. The current model earns the money required to train the next model.
That is the demand structure against which every subsequent part of the map has to be read.
THE FLOOR
One road, three institutions
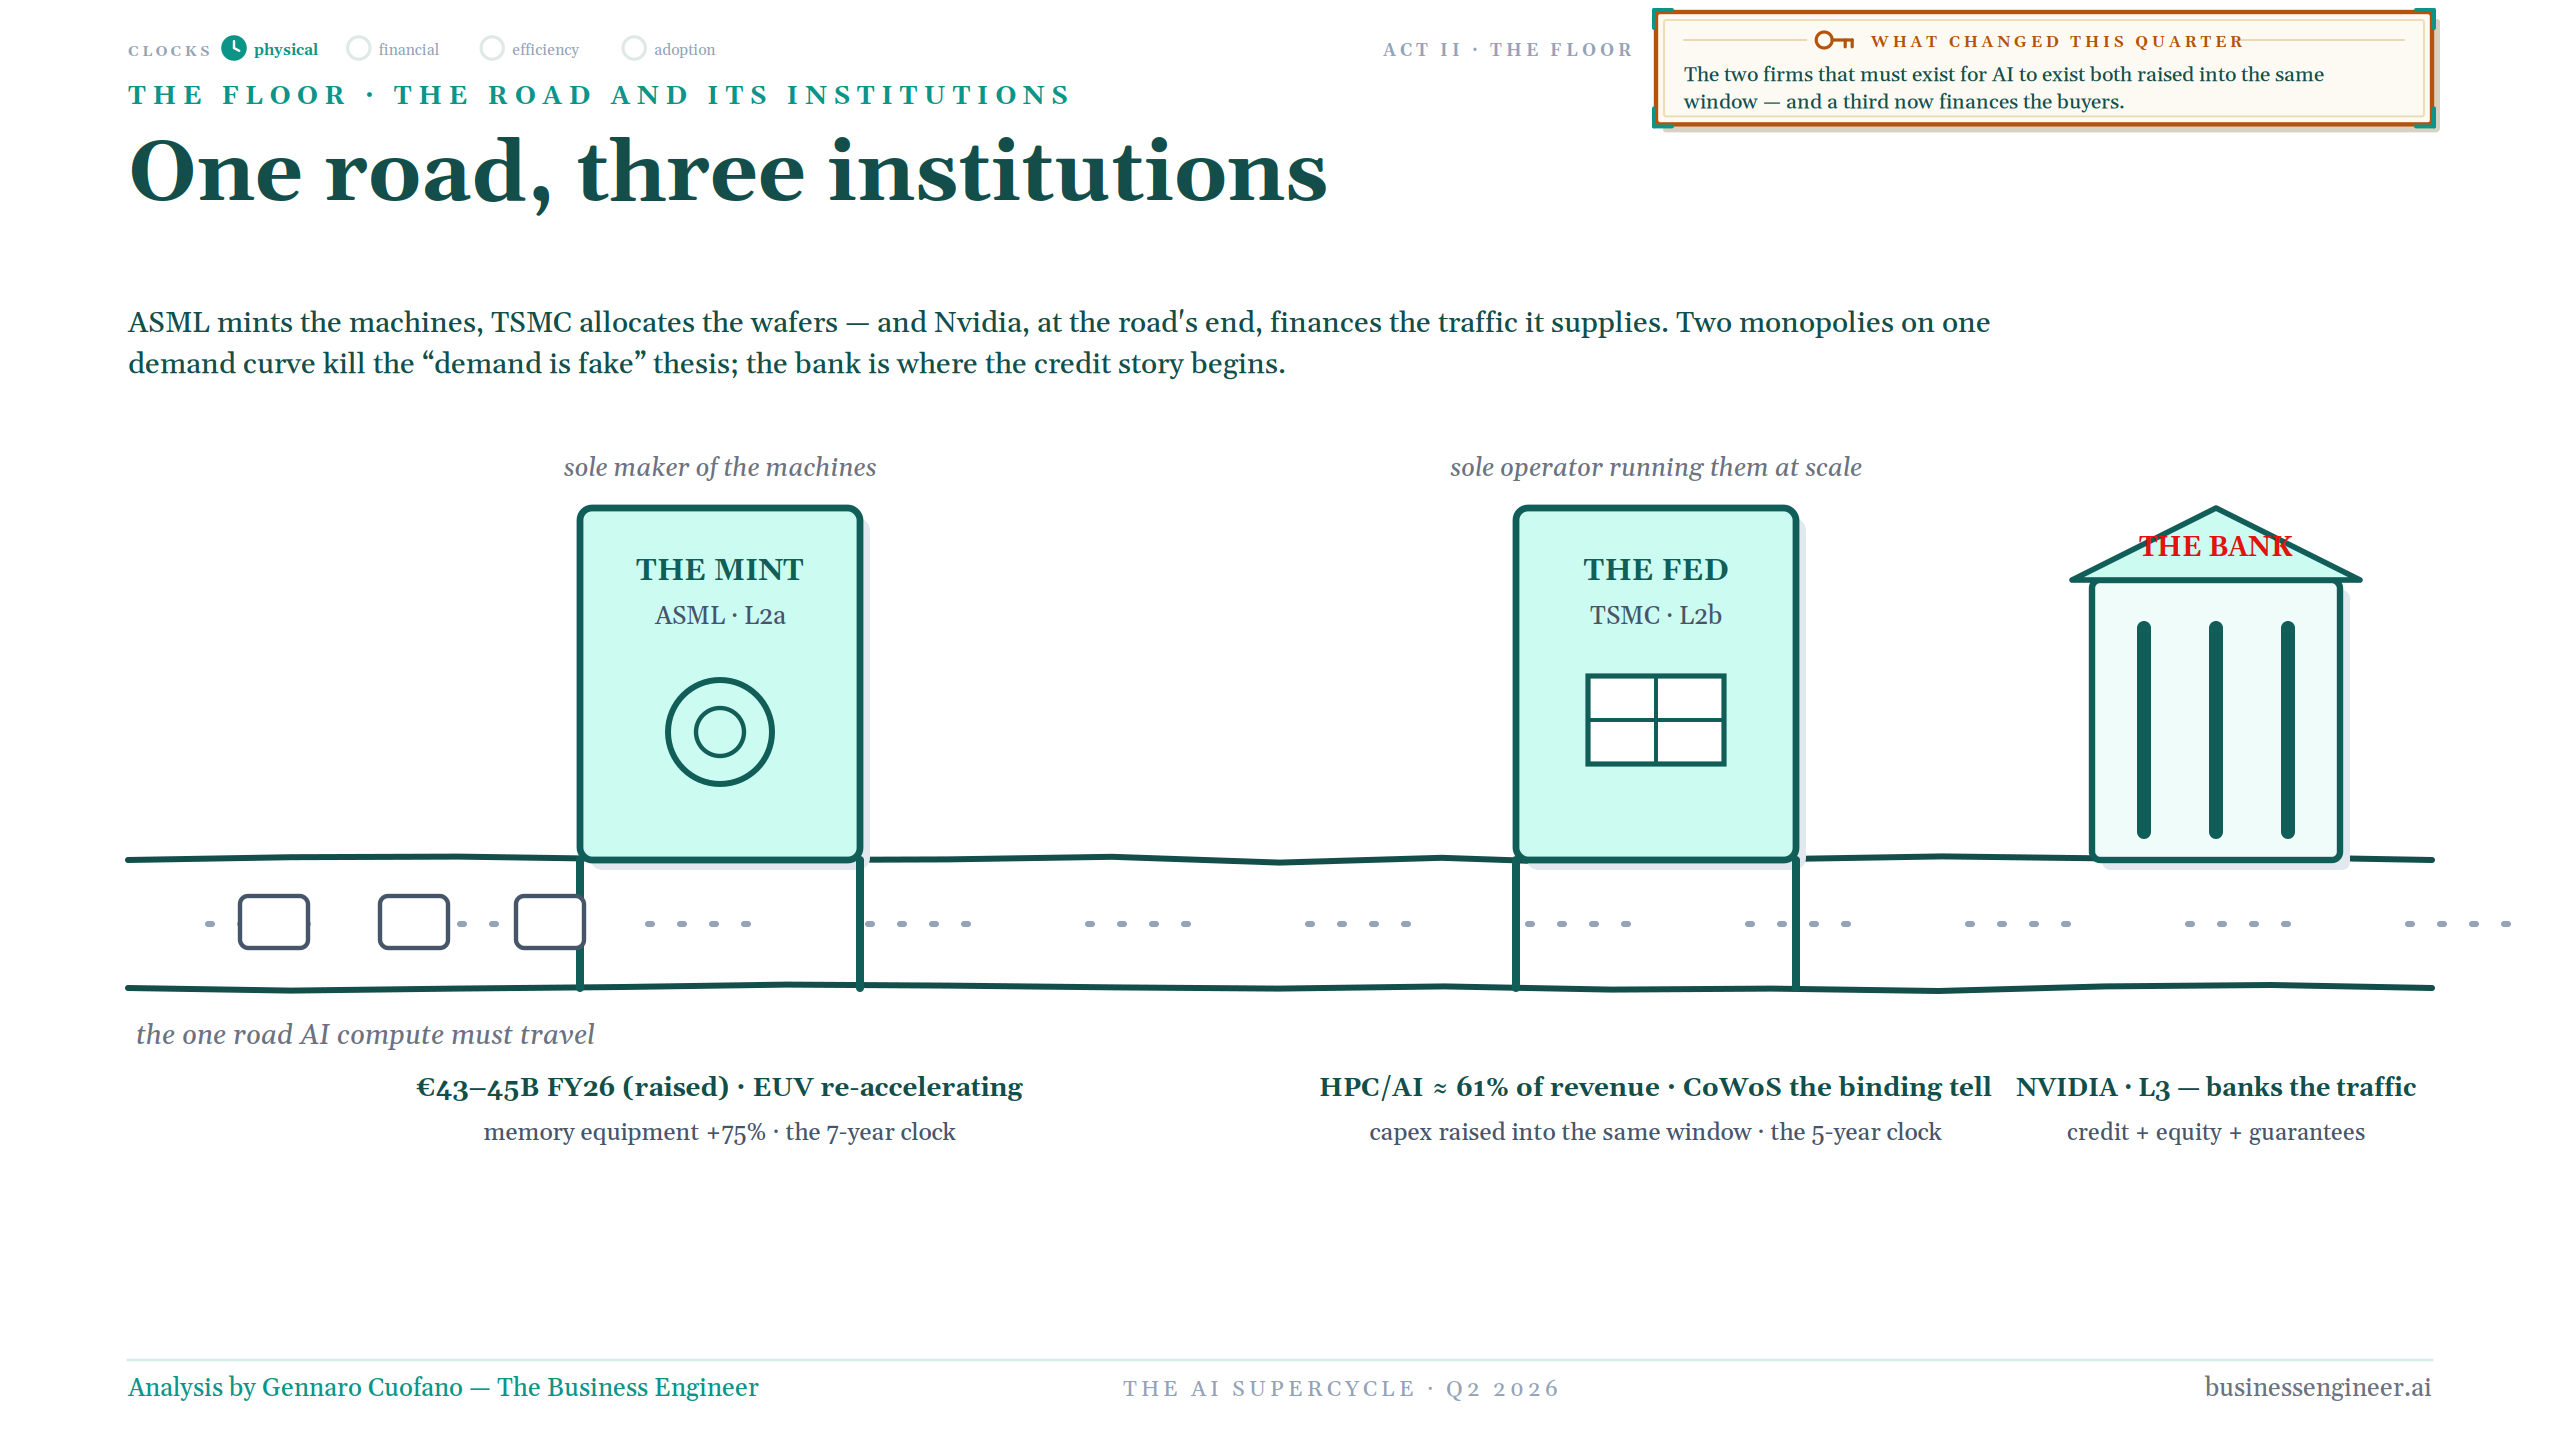
Once you move downward from the labs, the system becomes physical very quickly. There is essentially one road that frontier AI compute has to travel, and three institutions now define different parts of it.
ASML is the mint. It makes the machines required to produce leading-edge chips. Its FY26 outlook has been raised toward roughly €43–45 billion, EUV is reaccelerating and memory equipment demand has surged. This is a seven-year clock.
TSMC is the Fed. It allocates the wafers and runs the fabrication system at scale. HPC and AI are now around 61% of revenue, CoWoS remains a binding tell, and capex has been increased into the same demand window. This is closer to a five-year clock.
Then comes NVIDIA, increasingly the bank. At the end of the road, it does more than sell the traffic the road carries. It is increasingly helping finance pieces of the ecosystem consuming it.
That combination is analytically powerful. Two independent institutions with extraordinary market power, ASML and TSMC, are looking at the same physical demand curve from different positions and raising capacity expectations into the same window. That makes the claim that the underlying demand is simply fictitious increasingly difficult to sustain.
But it does not tell us whether every dollar of that demand will ultimately earn an acceptable return. That is a different question.
The zero-sum wafer
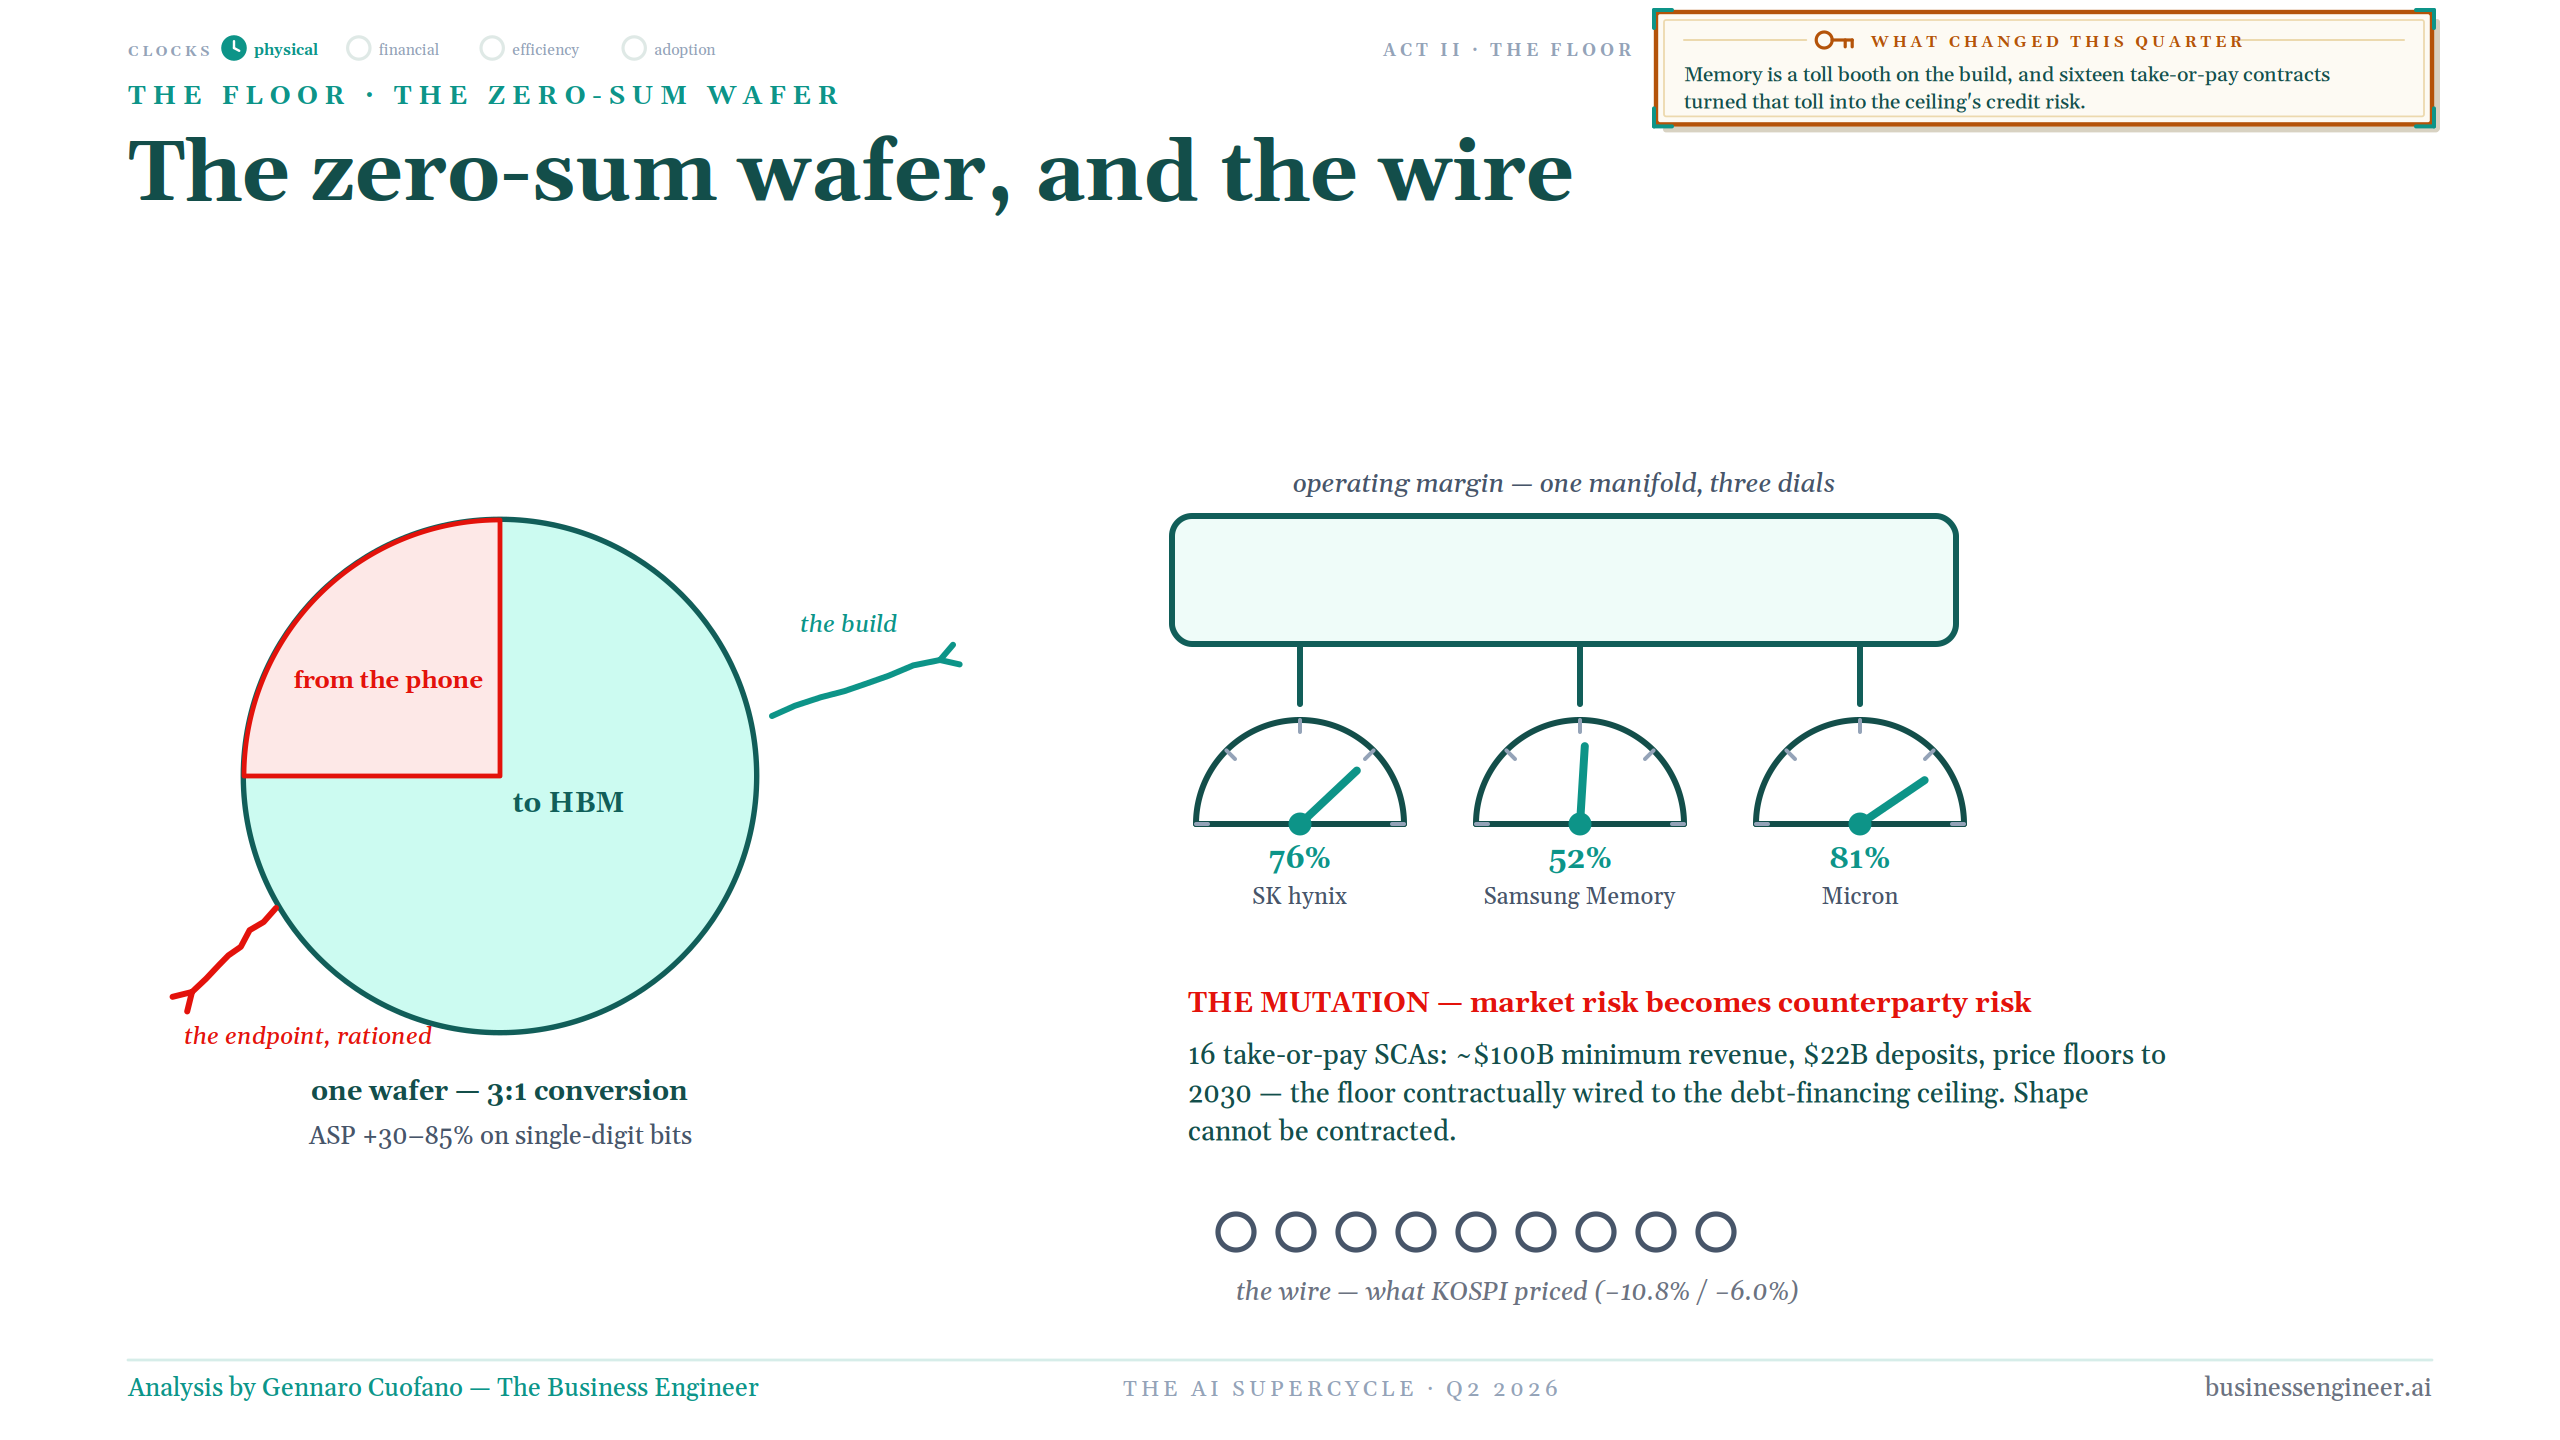
Memory shows why the distinction matters. A wafer is a scarce object. Once capacity is directed into one use, it cannot simultaneously serve another. The economics of HBM have therefore reshaped the memory business.
The conversion is effectively zero-sum. Redirect capacity away from consumer endpoints and into HBM, and the economics of the same underlying wafer can change dramatically. In the current framework, the wafer requirement can translate into roughly a 3:1 trade-off, while average selling prices have risen on the order of 30–85% against comparatively modest bit growth.
The result is extraordinary operating economics. SK hynix, Samsung Memory and Micron have been printing margins associated with a market under severe tightness.
But then something important happened. Memory companies increasingly wired the future through long-duration take-or-pay structures. The map counts sixteen take-or-pay agreements, roughly $100 billion of minimum revenue, around $22 billion of deposits, and price floors extending toward 2030.
At that moment, the risk mutated. The question stopped being Will someone buy the memory? It became Will the counterparty still be able to pay for the memory it already promised to buy?
Market risk became counterparty risk.
That is a recurring pattern in this supercycle: once scarcity gets contractualized, the economics look safer precisely because the risk has migrated somewhere else.
The memory race is a race over distance
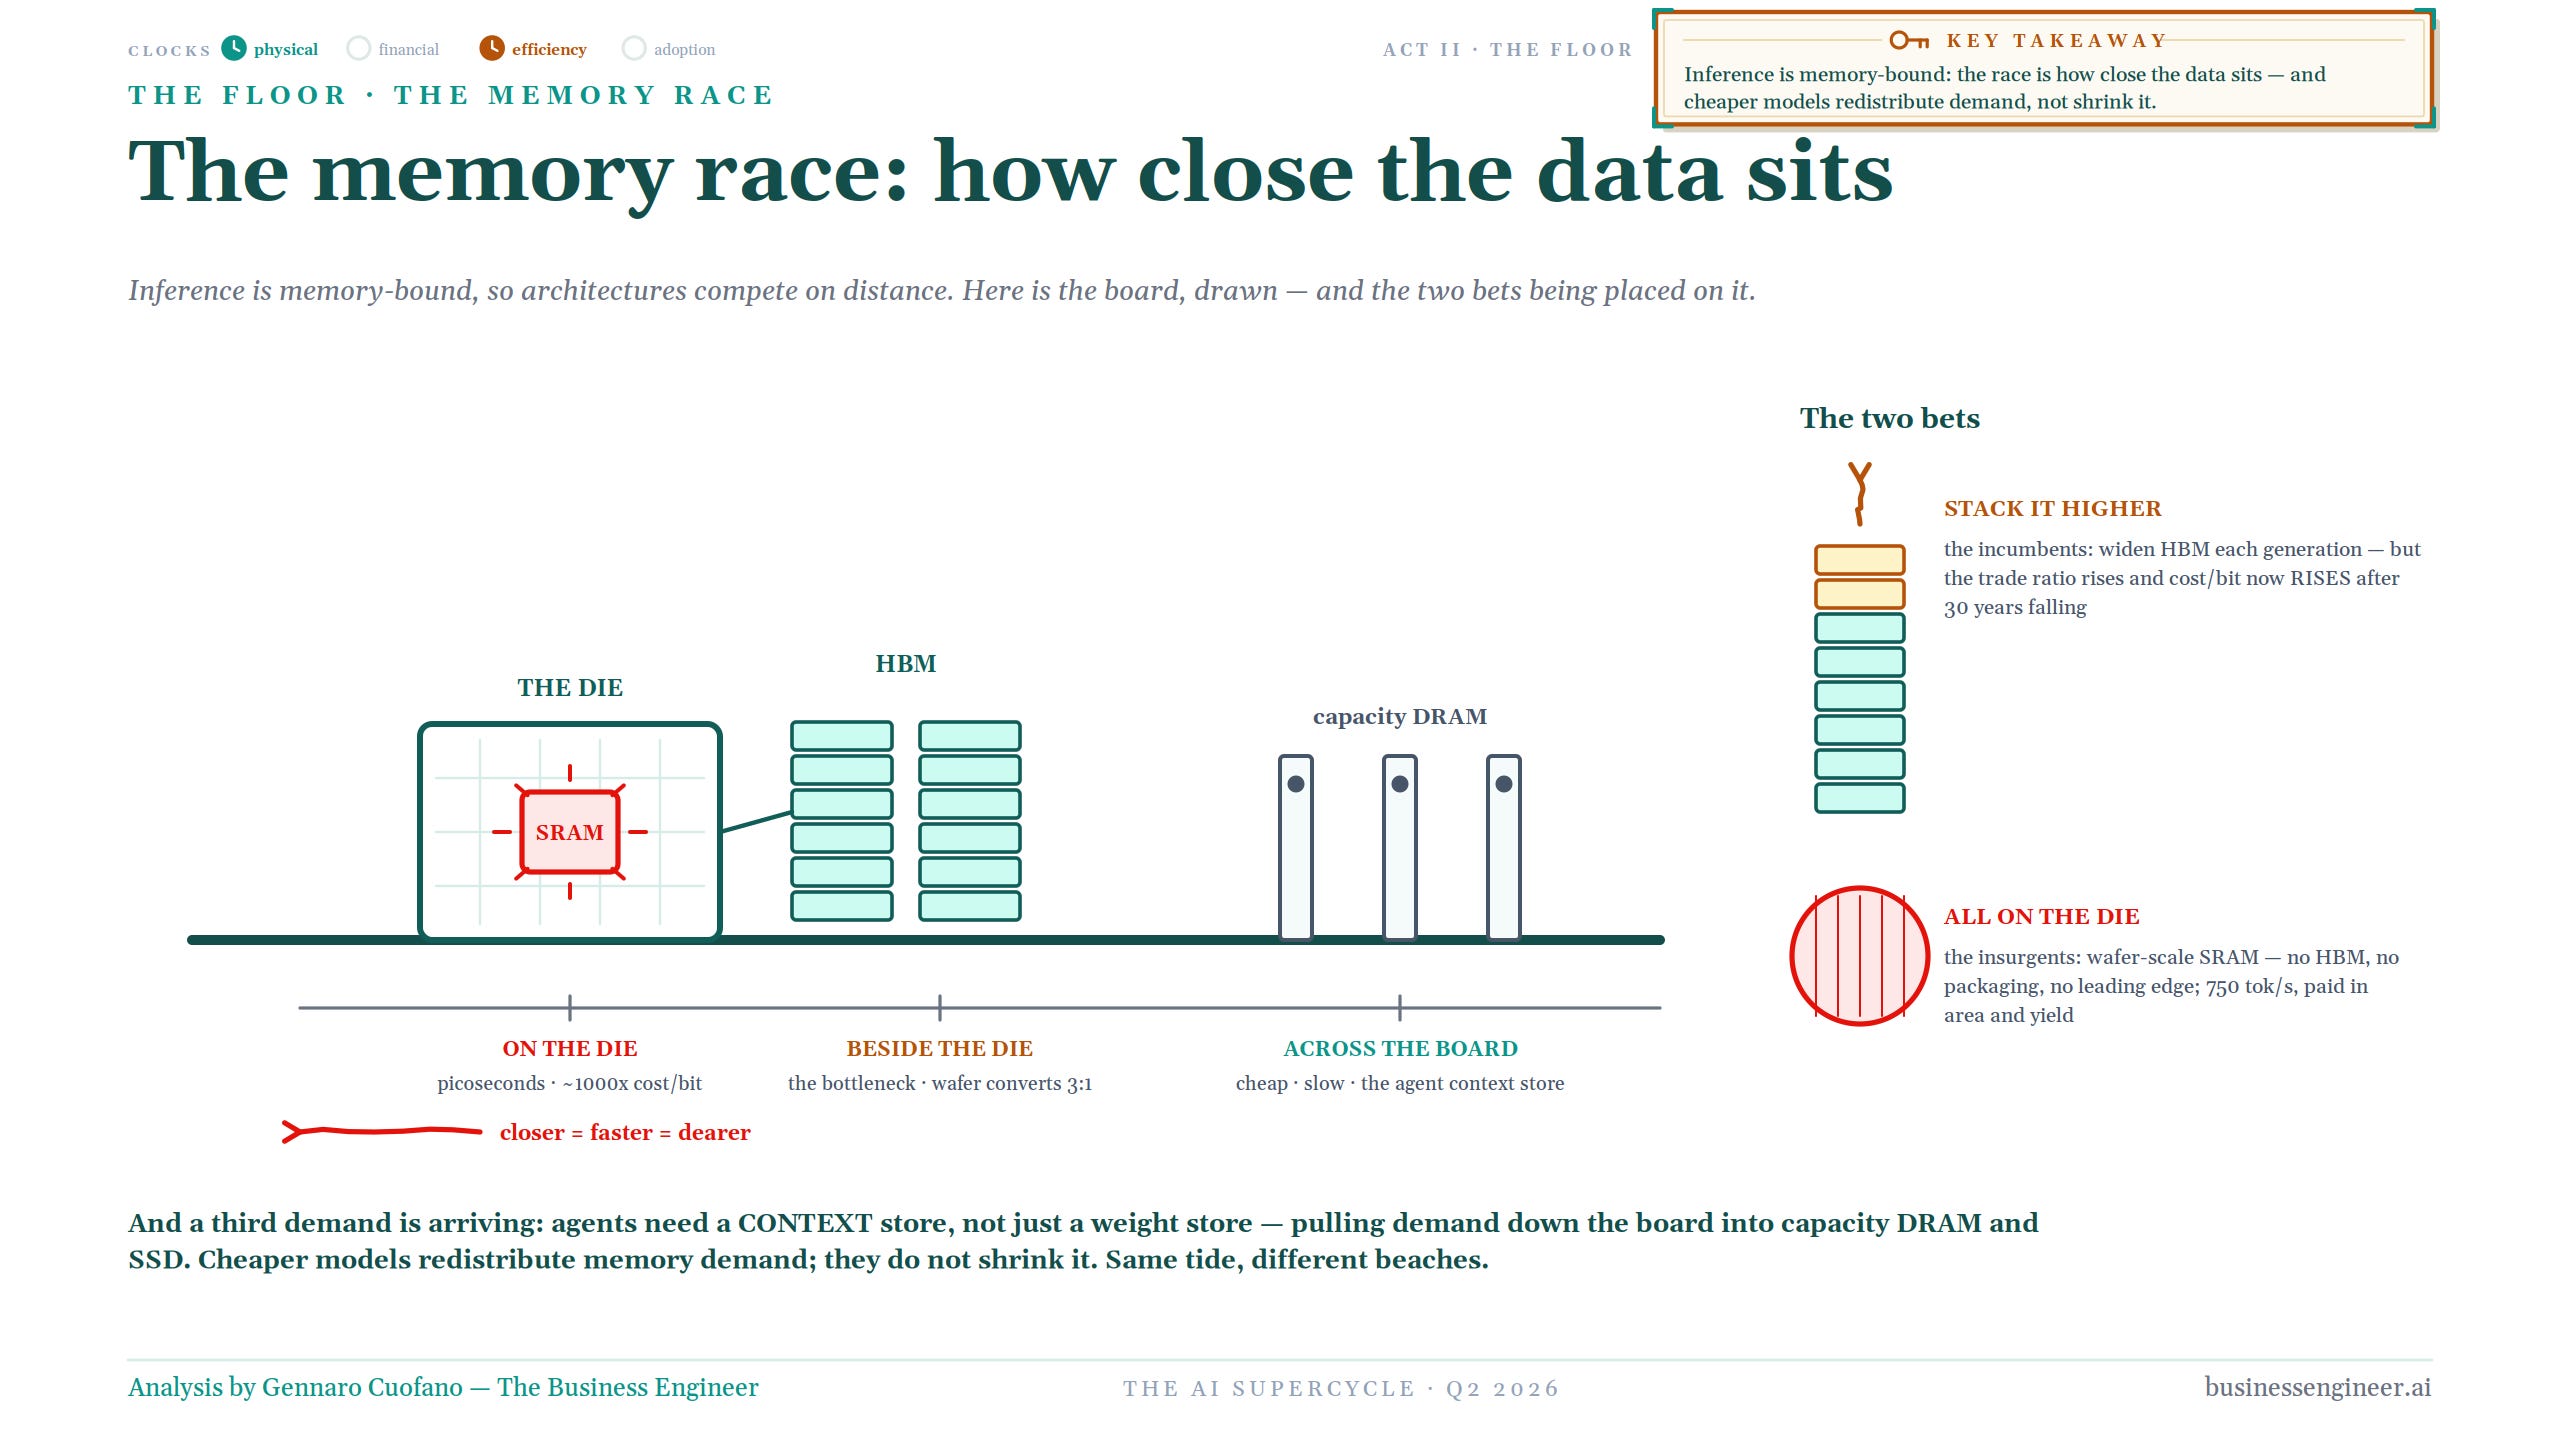
HBM is only one part of the memory story. Inference is memory-bound, so the architecture increasingly becomes a competition over how close the data can sit to the computation.
On-die SRAM is extraordinarily fast and extraordinarily expensive. HBM sits beside the die and offers a compromise, but it is itself a bottleneck because of wafer consumption and packaging complexity. Conventional capacity DRAM sits farther away: cheaper, slower, but increasingly important as agents require persistent context stores rather than simply weight stores.
This creates two different bets. The incumbent path is to stack HBM higher. Every generation widens the memory system, but the trade ratio becomes more demanding and cost per useful bit can rise after decades of decline.
The alternative is to move toward more memory directly on the die, as wafer-scale architectures attempt to do, bypassing pieces of the HBM and packaging bottleneck altogether.
Agents add yet another layer to this race. A model does not simply need somewhere to store its weights. An agent needs somewhere to store its world: context, previous work, tool state, intermediate outputs and memory.
Cheaper models do not necessarily reduce memory demand. They redistribute it.
Three roads to an AI chip
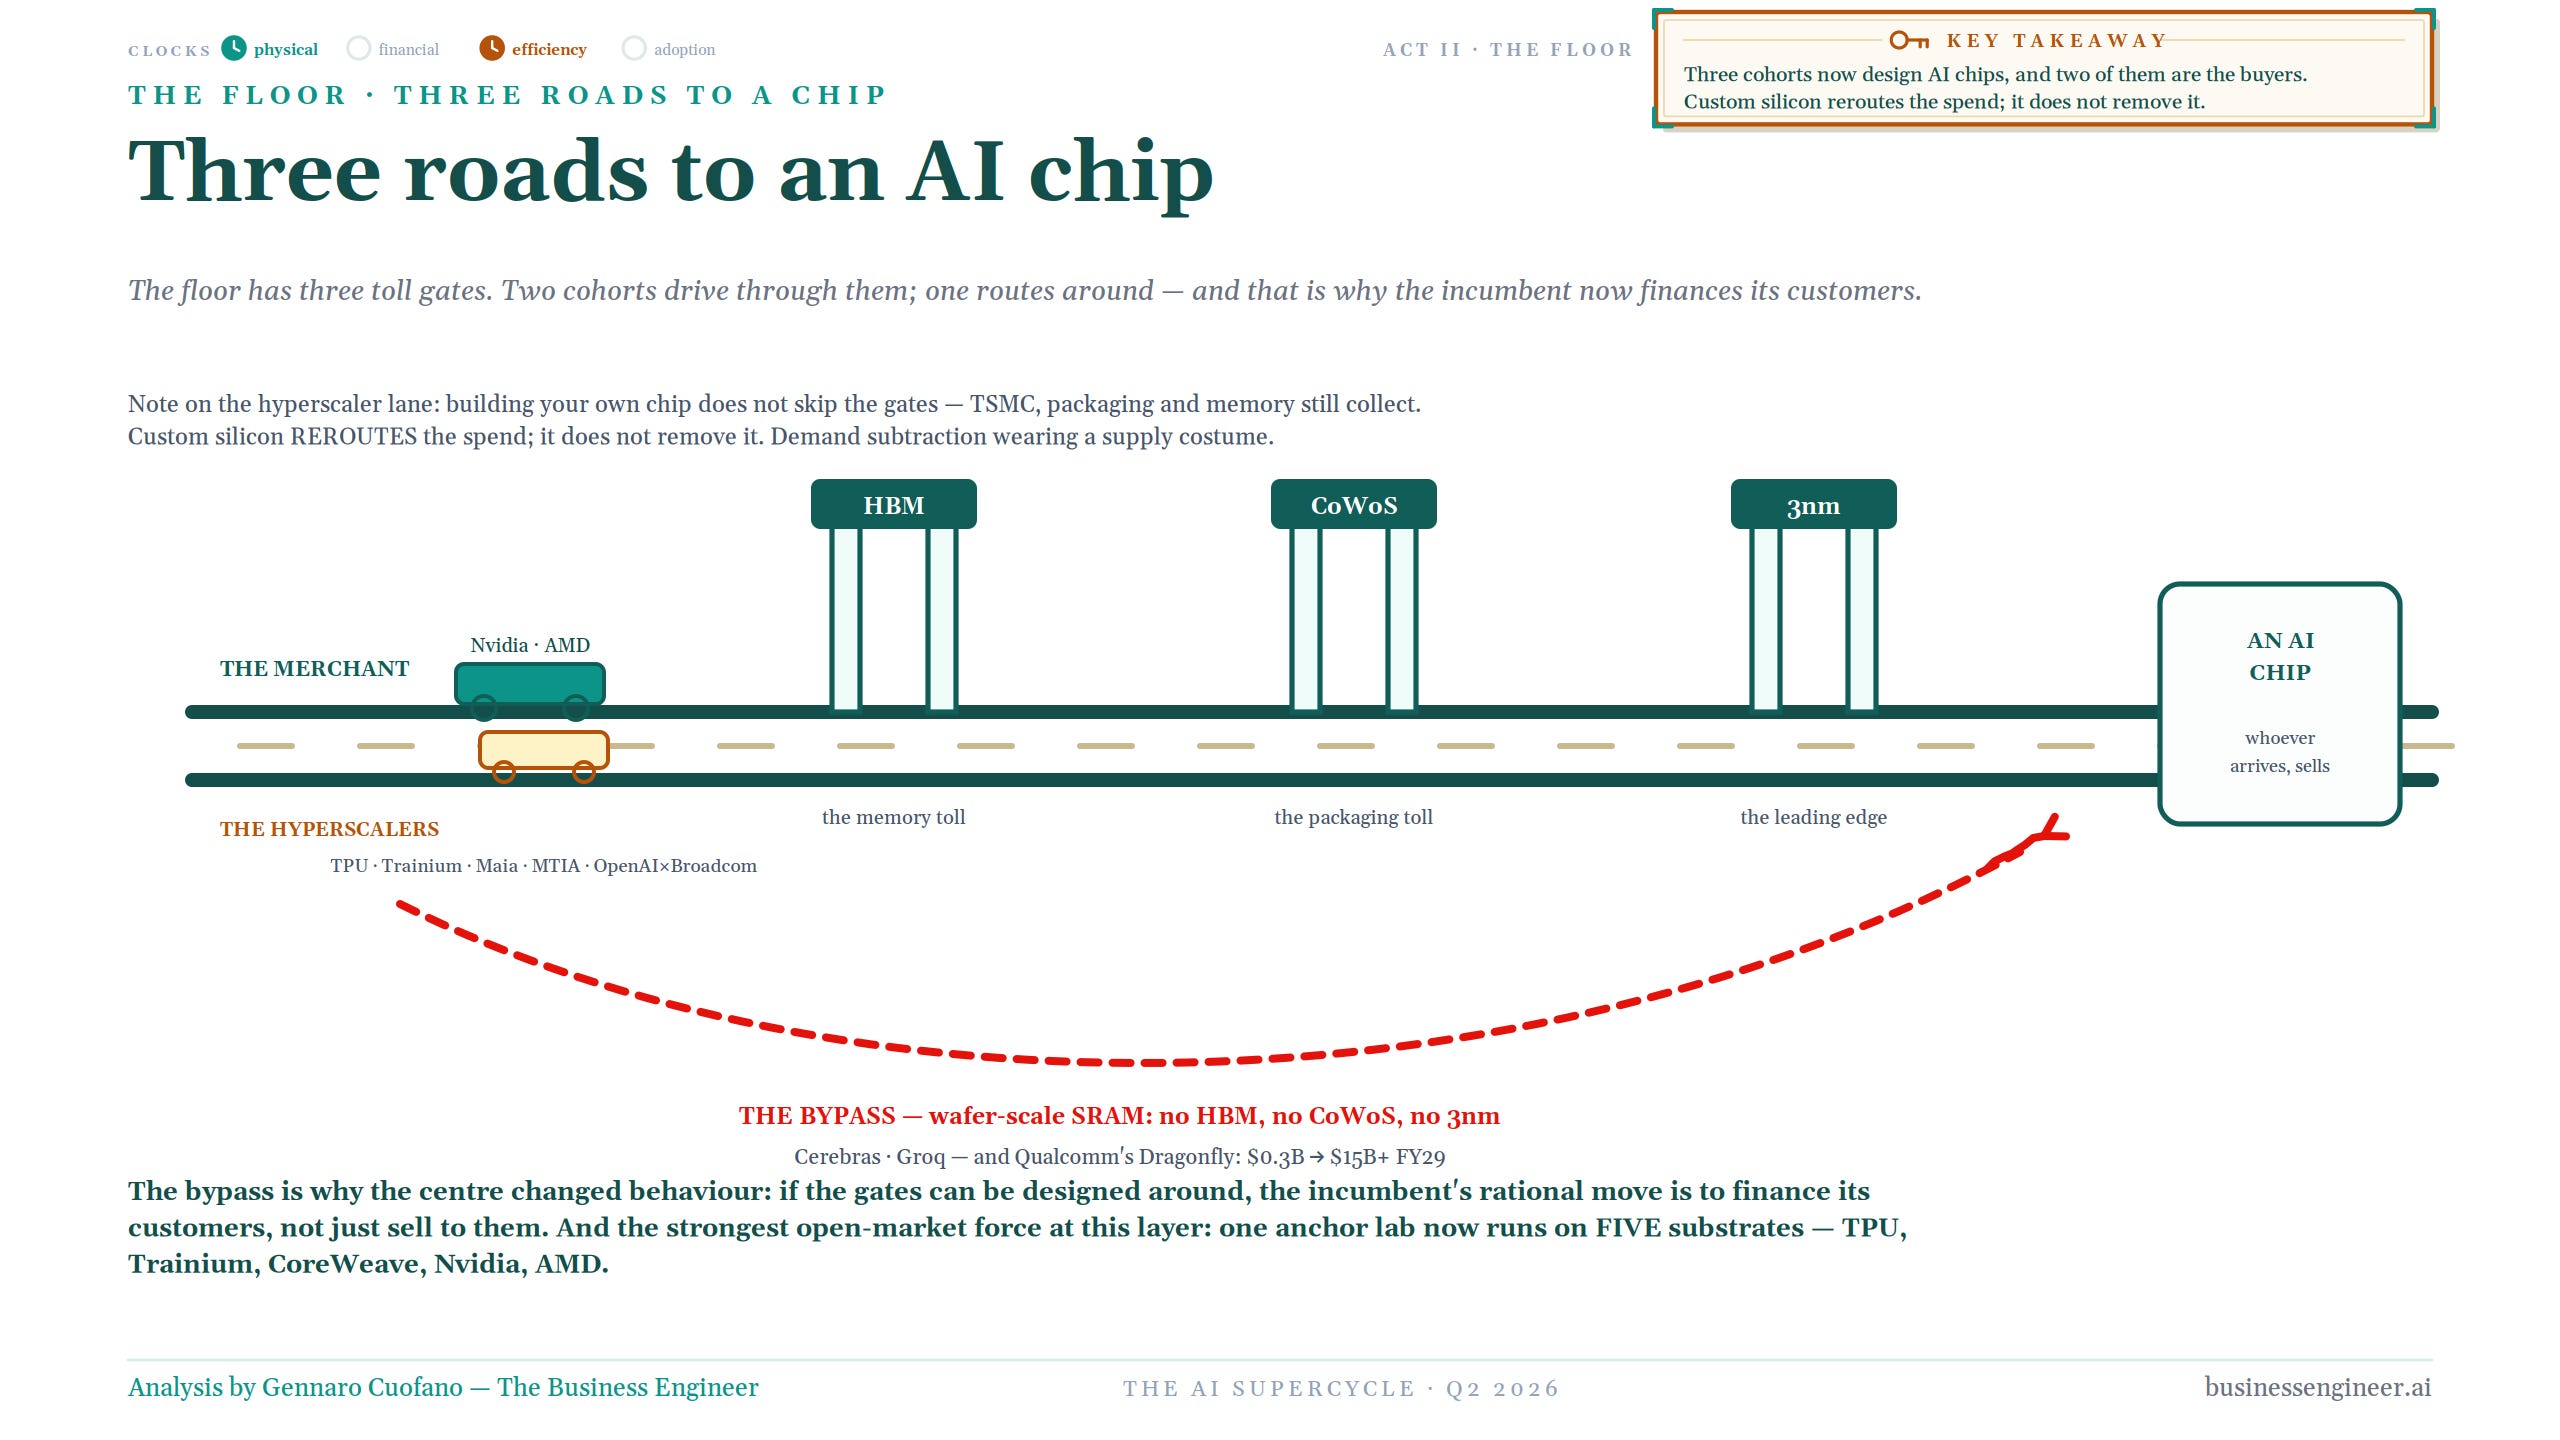
The chip market itself is therefore splitting into three routes. The first is the merchant road, dominated by NVIDIA and AMD. The second is the hyperscaler road, where Google, Amazon, Microsoft, Meta and others increasingly design their own silicon.
But building your own chip does not make the physical gates disappear. The hyperscaler still needs fabrication. It still needs memory. It still needs packaging. It still needs the leading edge.
Custom silicon reroutes the spend. It does not remove it.
Then there is a third route: architectures that attempt to bypass portions of the conventional stack entirely, particularly through wafer-scale approaches and radically different memory choices.
That bypass matters because it changes the strategic behavior of the incumbent. If customers have plausible ways to design around your strongest bottlenecks, financing them can become rational.
The strongest evidence of how fluid this has become is that one anchor frontier lab can now operate across multiple substrates: TPU, Trainium, rented neocloud capacity, NVIDIA and AMD.
The floor remains scarce. But the roads across it are multiplying.
WHO PAYS FOR THE BUILD?
There are only five places the money can come from

On the framework’s current estimate, the AI build is running at roughly $750 billion a year. That money has to come from somewhere.
There are only five sources, and they become progressively more fragile as you move down the list. The safest is own cash flow. Alphabet, Microsoft, Meta and Amazon can use profits generated elsewhere to finance infrastructure.
Then come the capital markets: bonds, private credit and off-balance-sheet vehicles.
Then the customer in advance: backlog, prepayments, contracted revenue and take-or-pay arrangements. Then the supplier: vendor equity, receivables and guarantees. And finally everyone else, when the bill leaves the AI site through memory prices, higher power bills, cost inflation and the price of products containing the constrained components.
The most important change this quarter is not that any one of those sources appeared for the first time. It is that the money moved down the list. A year ago, much more of the structure could be read through the first two rows. This quarter, the bottom three began doing visibly more work.
One build, eight different financial realities
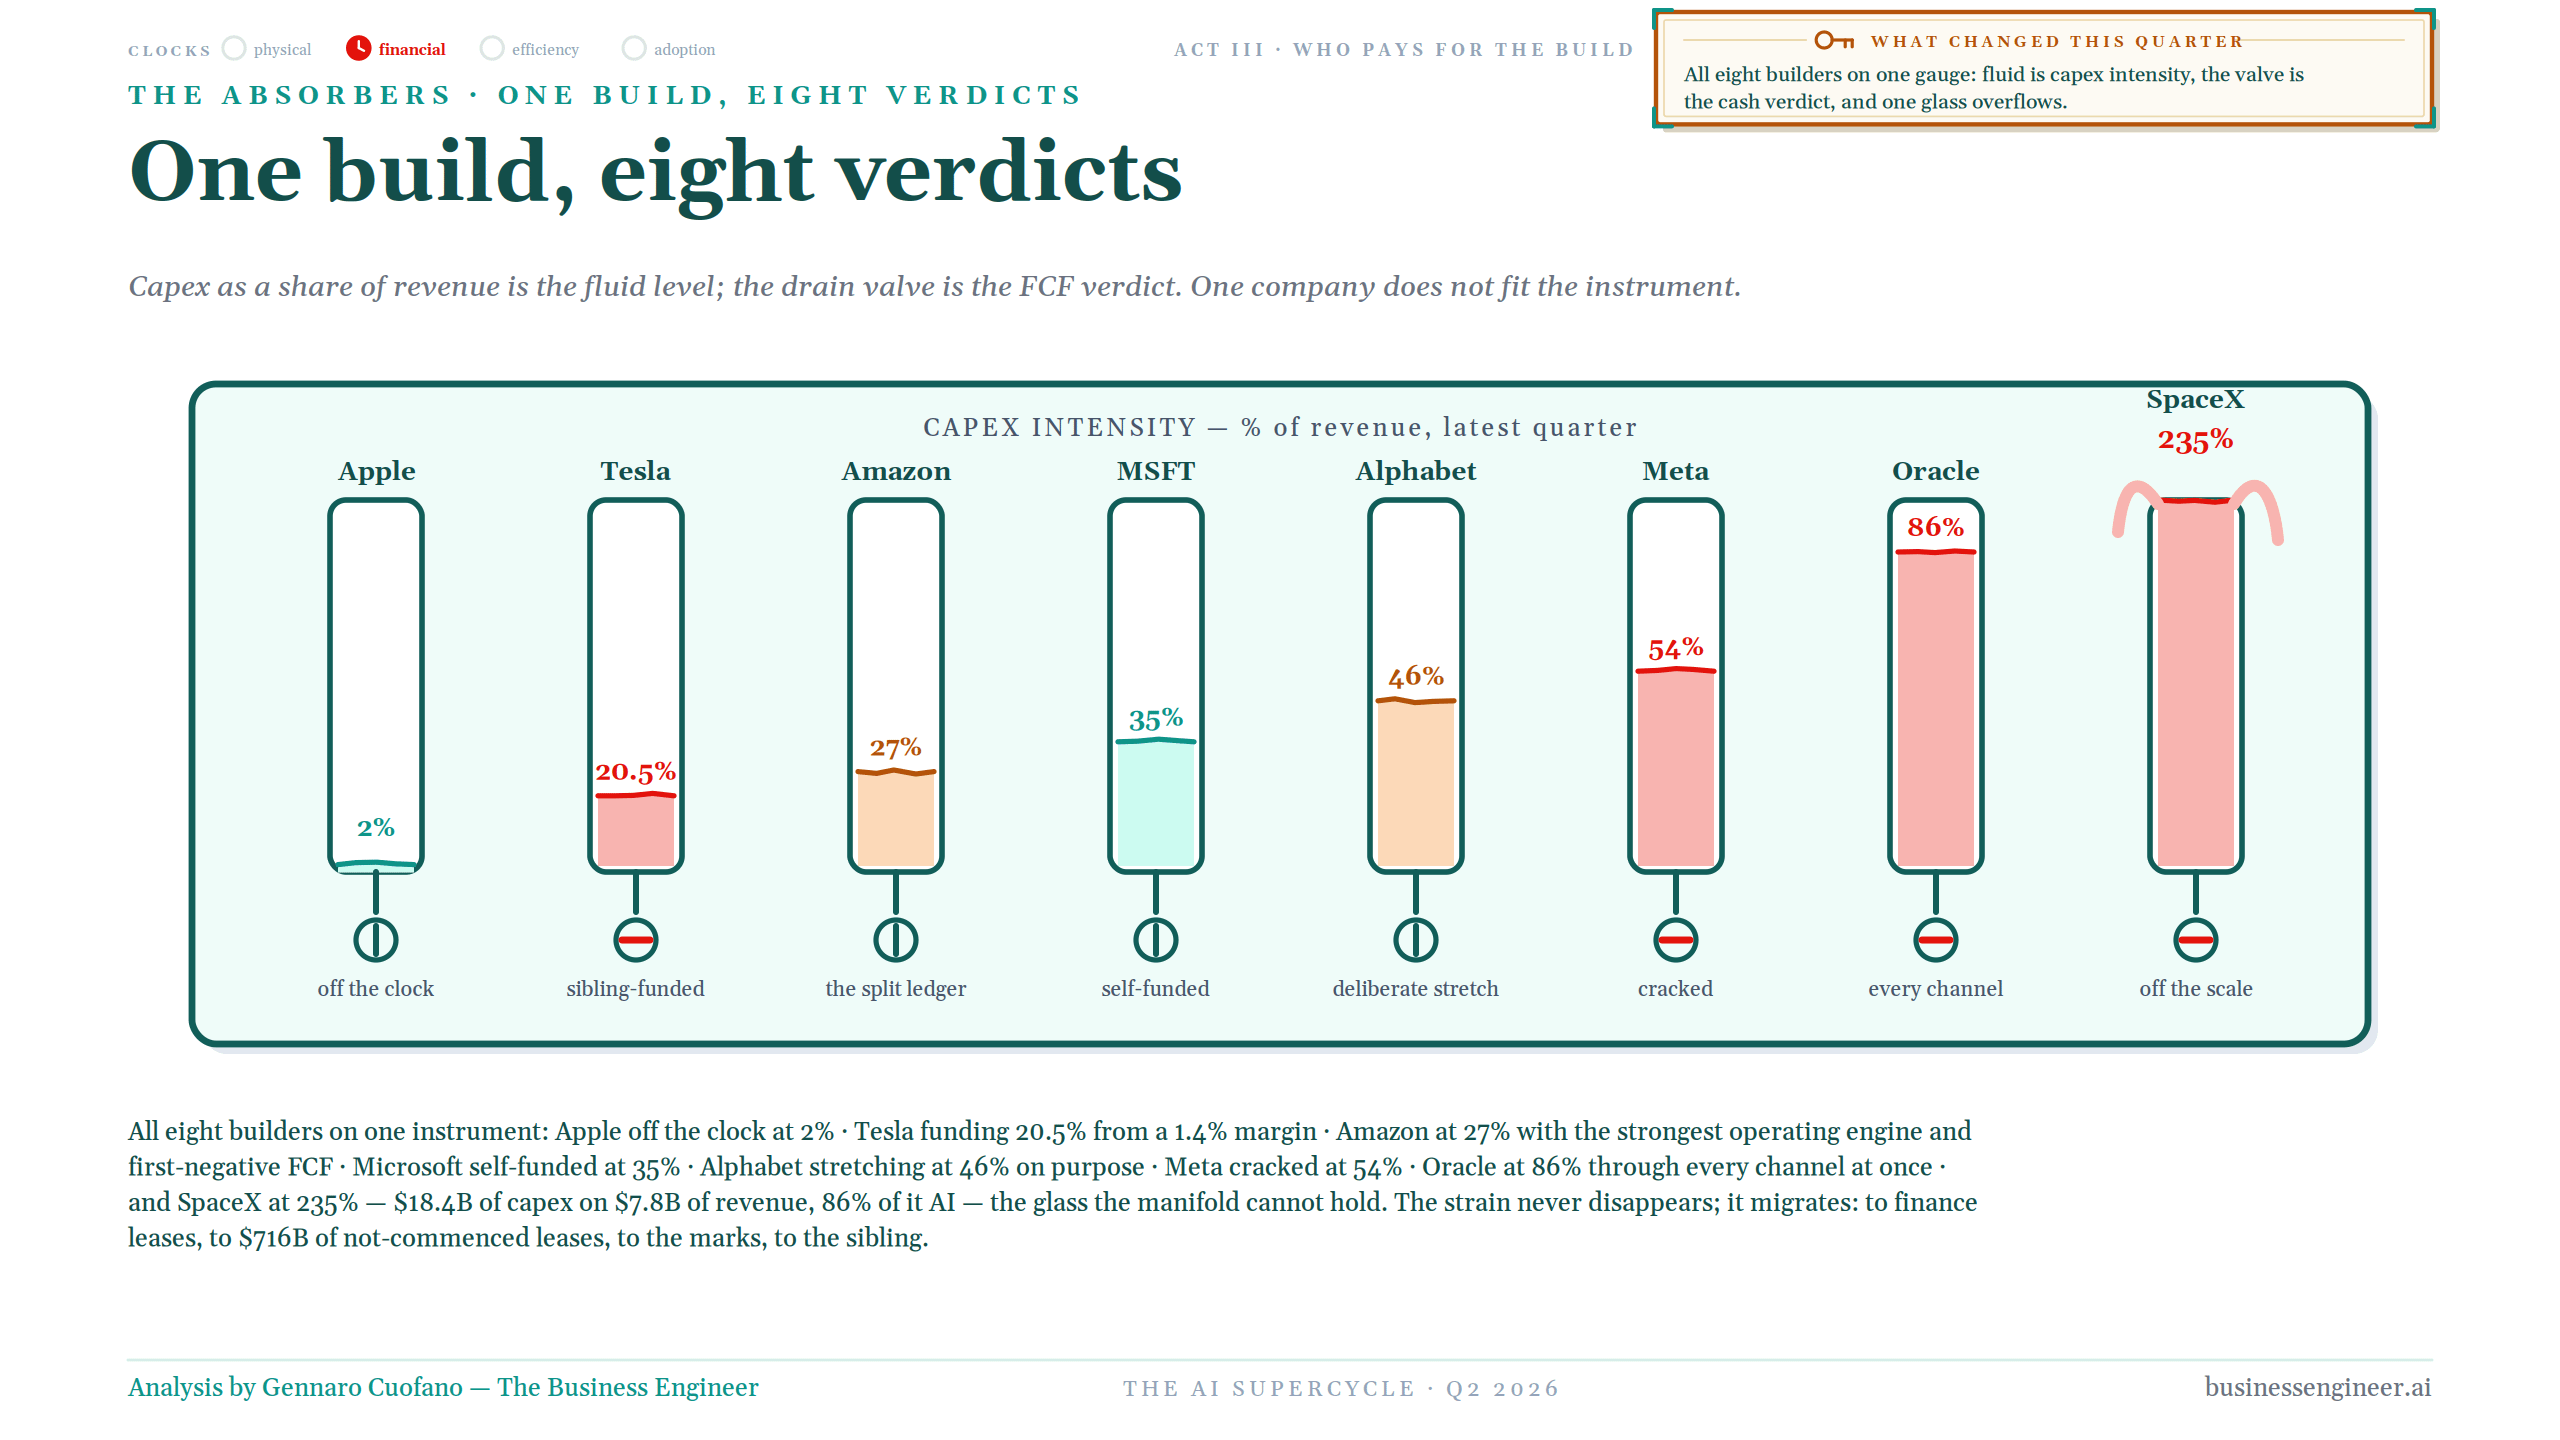
This is why simply quoting aggregate capex is almost useless. Put eight major builders on one instrument, with capex as a percentage of revenue as the fluid level, and the strategies look nothing alike.
Apple sits around 2%. Tesla around 20.5%. Amazon around 27%. Microsoft around 35%. Alphabet around 46%. Meta around 54%. Oracle around 86%. Then SpaceX arrives at roughly 235%, and the instrument breaks.
But even these percentages do not tell the whole story. The drain valve is free cash flow. Apple is essentially off the clock. Microsoft remains self-funded. Alphabet is deliberately stretching. Meta cracked its previous self-funding model. Oracle is pulling almost every available channel. SpaceX simply sits outside the conventional scale.
The strain never disappears. It migrates.
Sometimes into finance leases. Sometimes into debt. Sometimes into customer commitments. Sometimes into investment marks. Sometimes into another company entirely.
Alphabet: the Absorber, and the cage it built
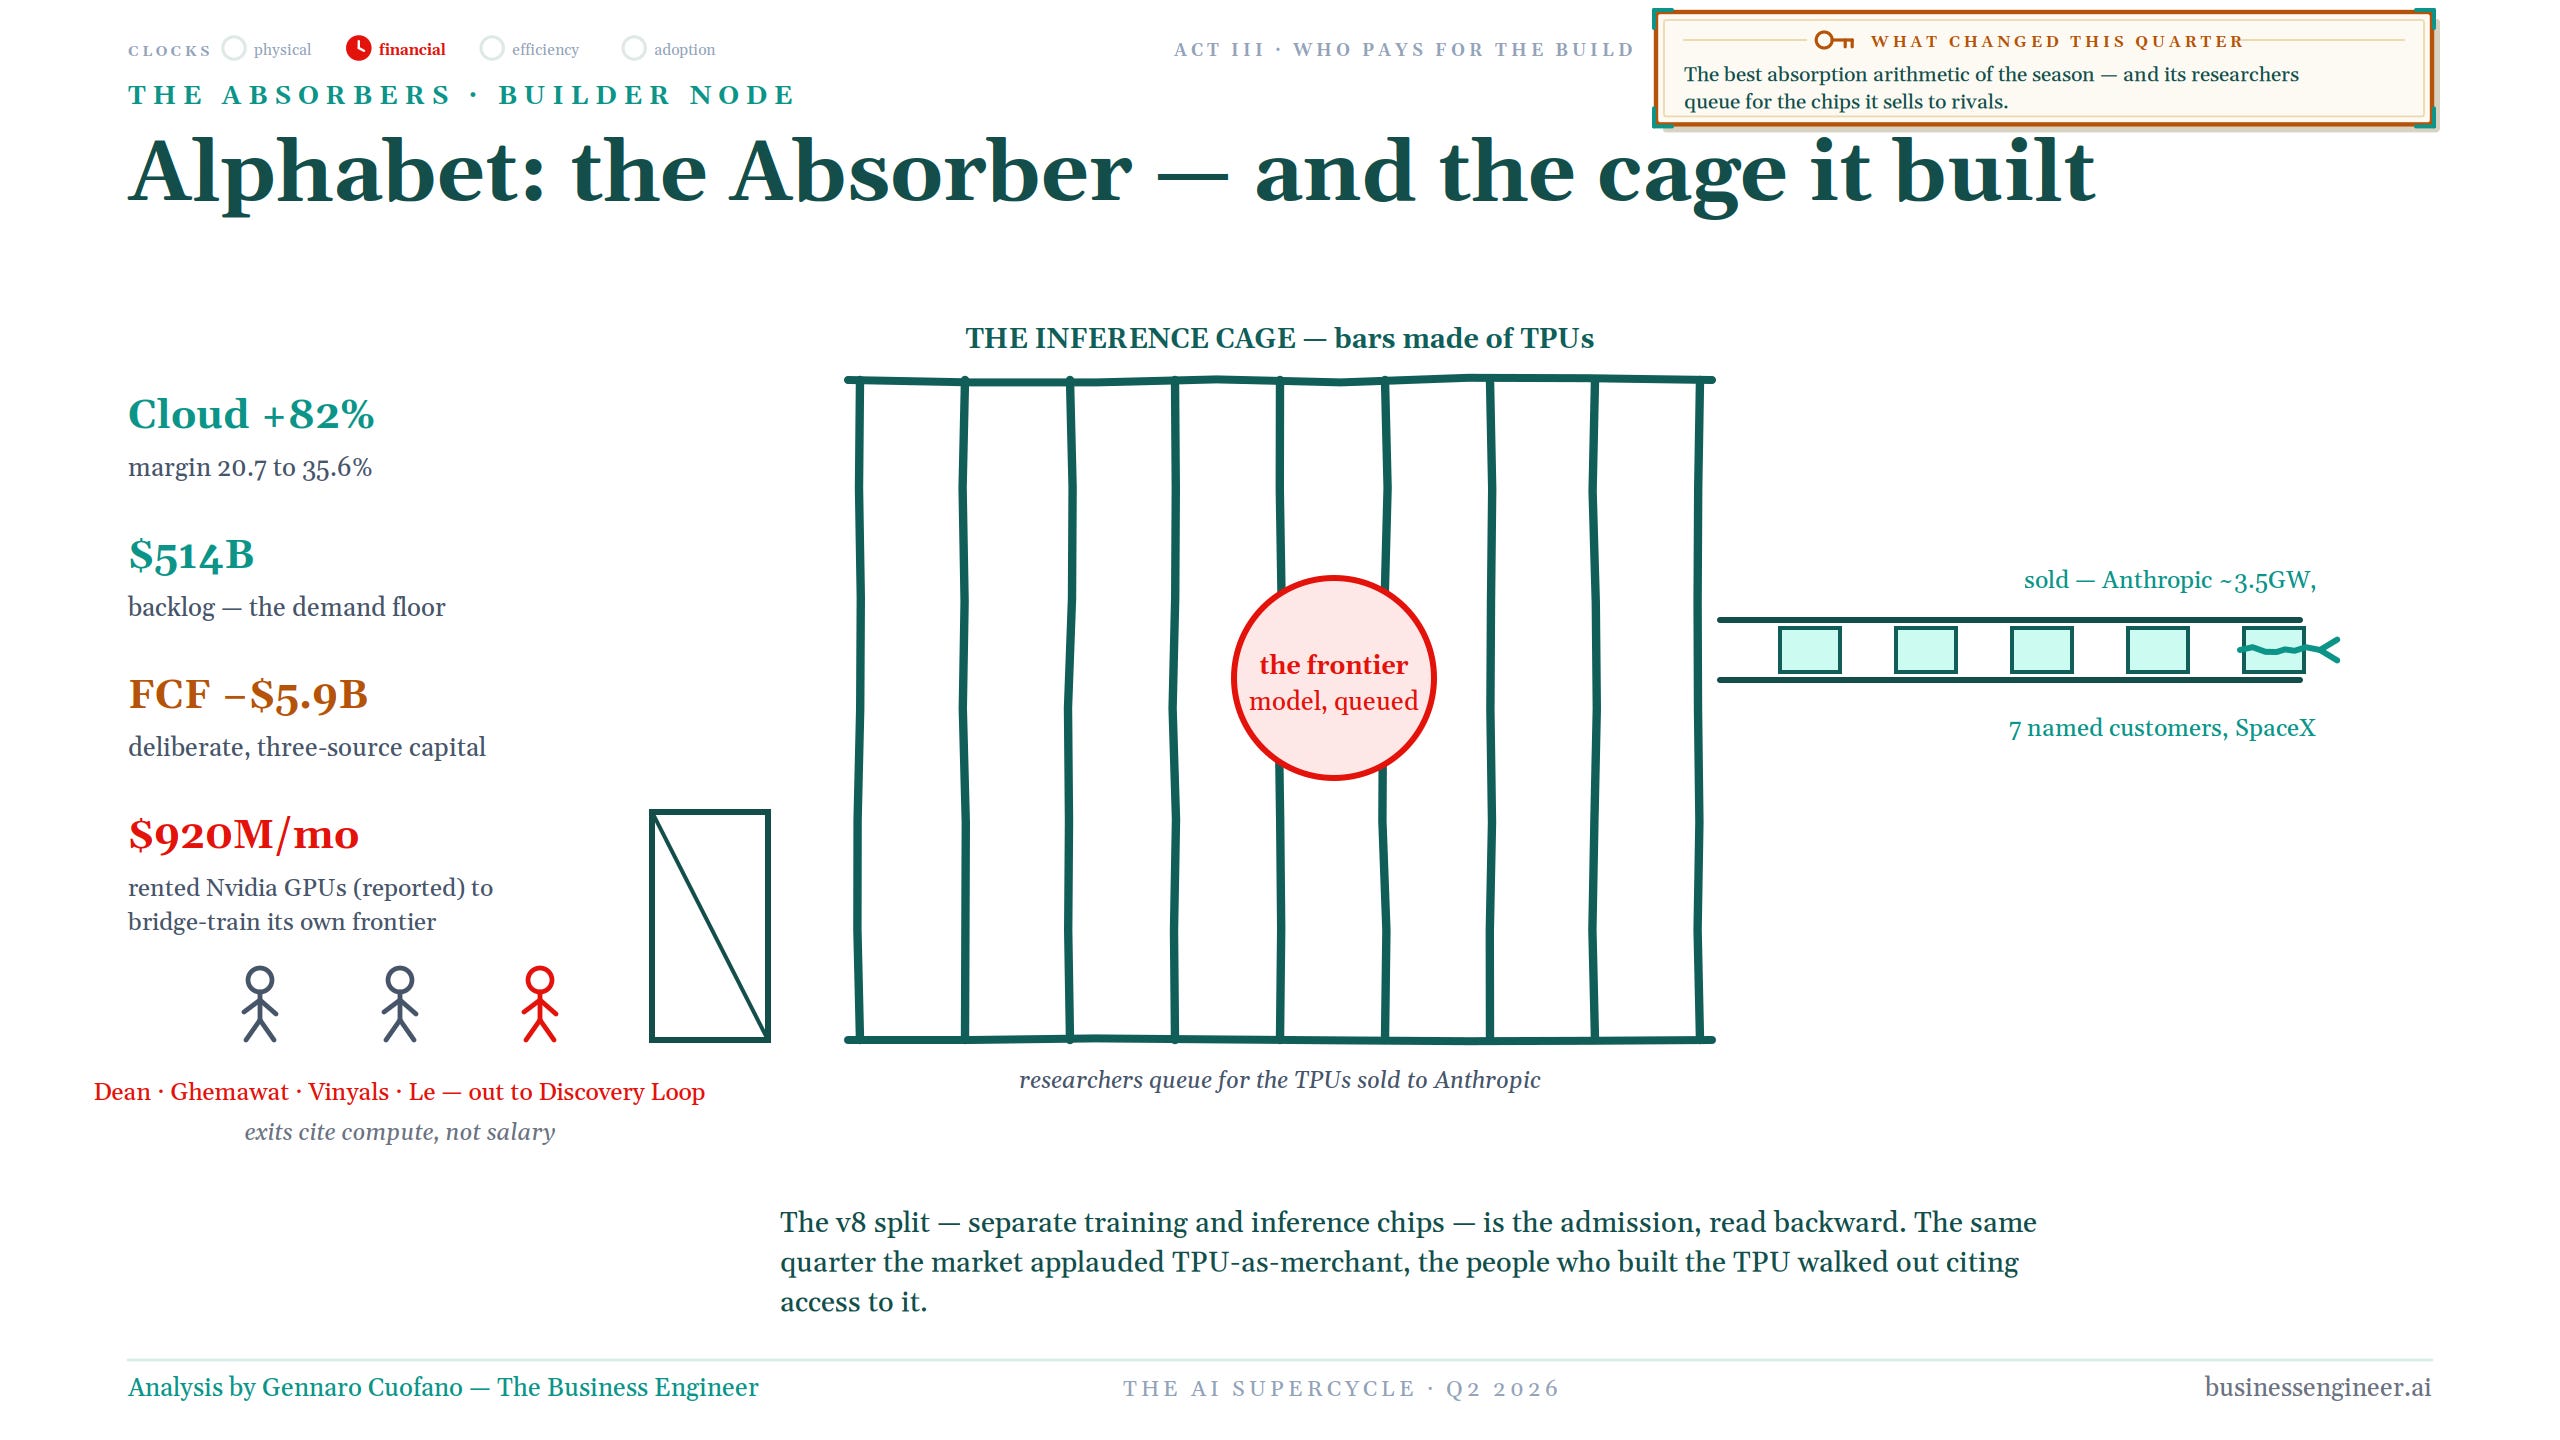
Alphabet might offer the strongest absorption arithmetic in the group. Cloud revenue is growing roughly 82%, margins have expanded from approximately 20.7% to 35.6%, backlog has reached around $514 billion, yet free cash flow has moved to roughly negative $5.9 billion.
That is not a weak company losing control of its economics. It is a fortress deliberately stretching its balance sheet to become an infrastructure company.
But Alphabet has another problem, and it is more interesting. It built the TPU as an internal advantage. Then the TPU became commercially valuable enough to sell externally. Anthropic alone is associated with roughly 3.5 gigawatts of capacity, alongside several other customers.
Now Alphabet’s own frontier researchers increasingly compete for access to the capacity the company sells. The frontier model is effectively queued inside an inference cage made of TPUs.
At the same time, Alphabet reportedly rents roughly $920 million a month of NVIDIA capacity to bridge-train its own frontier.
The V8 architecture, split into distinct training and inference chips, can therefore be read backward as an admission: once proprietary infrastructure becomes a successful merchant product, internal advantage and external monetization begin competing with each other.
Alphabet built the cage. Then it discovered that the market wanted to rent the bars.
Microsoft: absorbed above the waterline
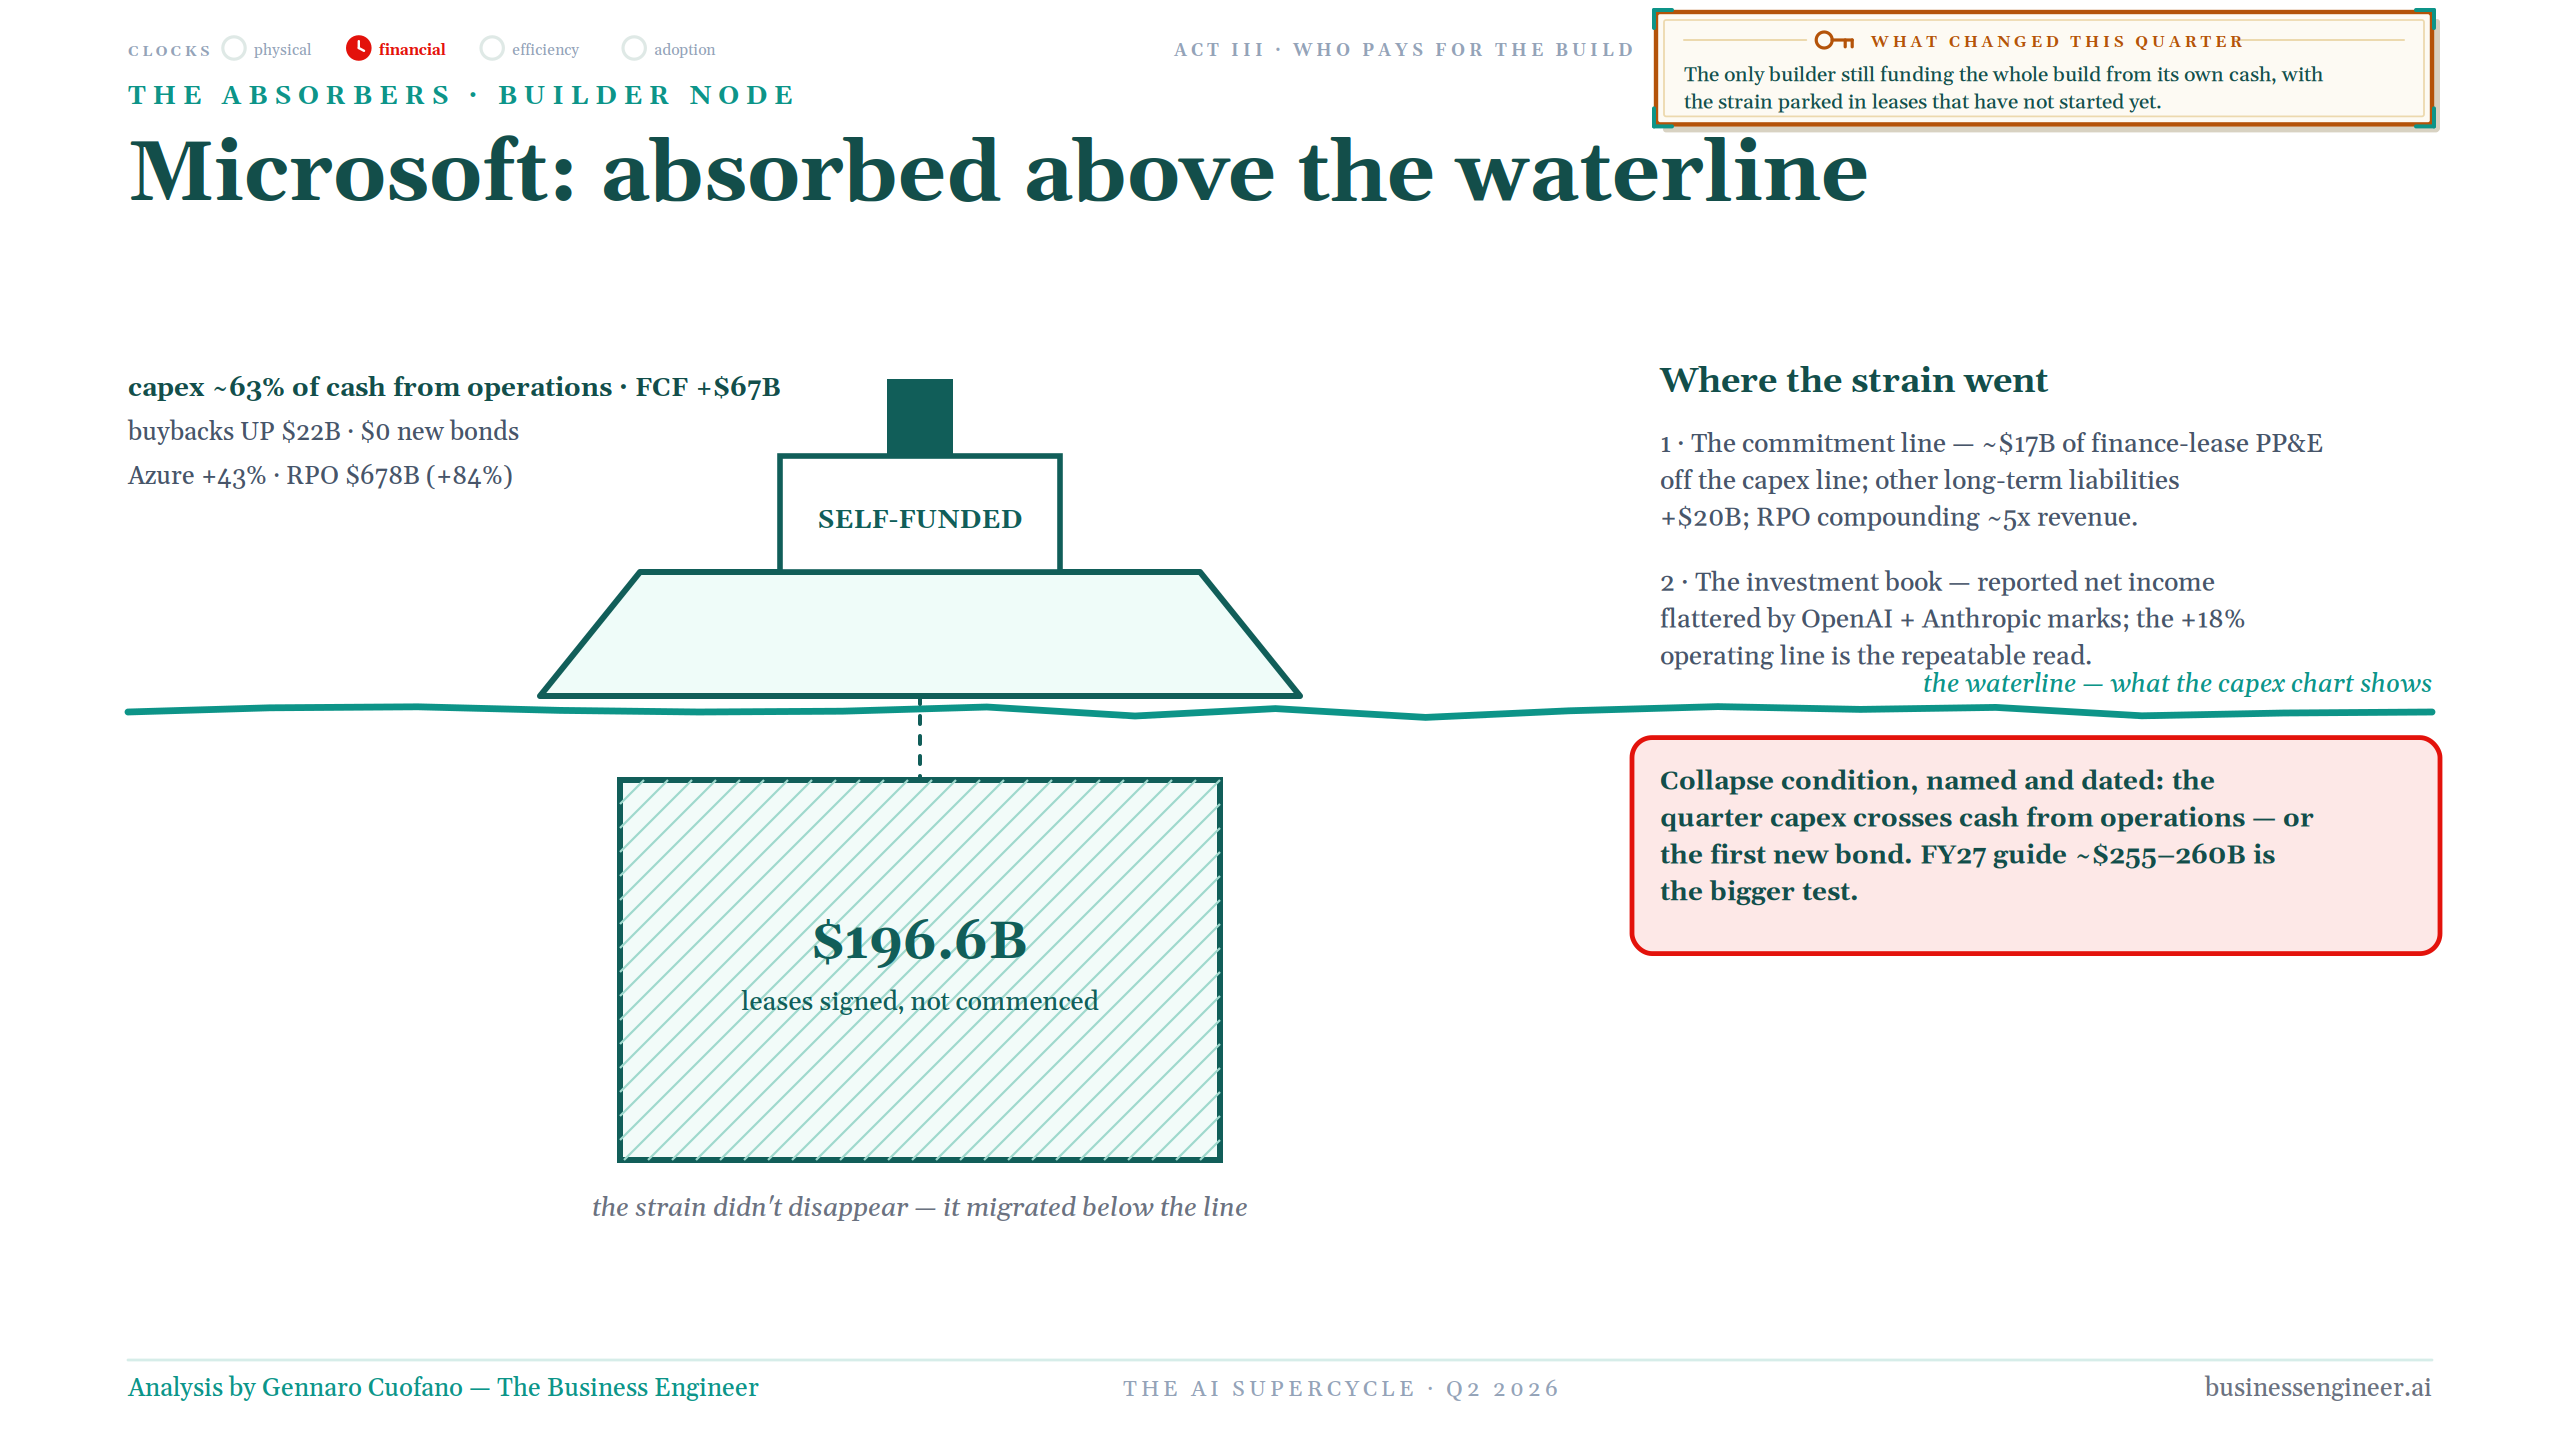
Microsoft remains the cleanest large-scale example of the build being funded from the existing operating engine. Capex is roughly 63% of cash from operations. Free cash flow remains strongly positive, around $67 billion in the framework. Buybacks increased by roughly $22 billion, and no new bonds were needed. Azure continues growing rapidly and RPO has expanded toward roughly $678 billion.
On the surface, the structure looks remarkably strong. But the strain did not disappear. It moved below the waterline.
Microsoft carries around $196.6 billion of leases already signed but not yet commenced, while additional finance-lease PP&E and long-duration commitments continue growing.
This is an important accounting lesson for the cycle. You cannot understand the build by reading the capex line alone. Infrastructure commitments can migrate into leases and future obligations without changing the underlying economic promise.
Microsoft has not cracked. But the test has been named. If capex eventually crosses cash from operations, or if financing moves meaningfully into new debt, the financial clock has changed.
Meta: the cistern and the shut valve
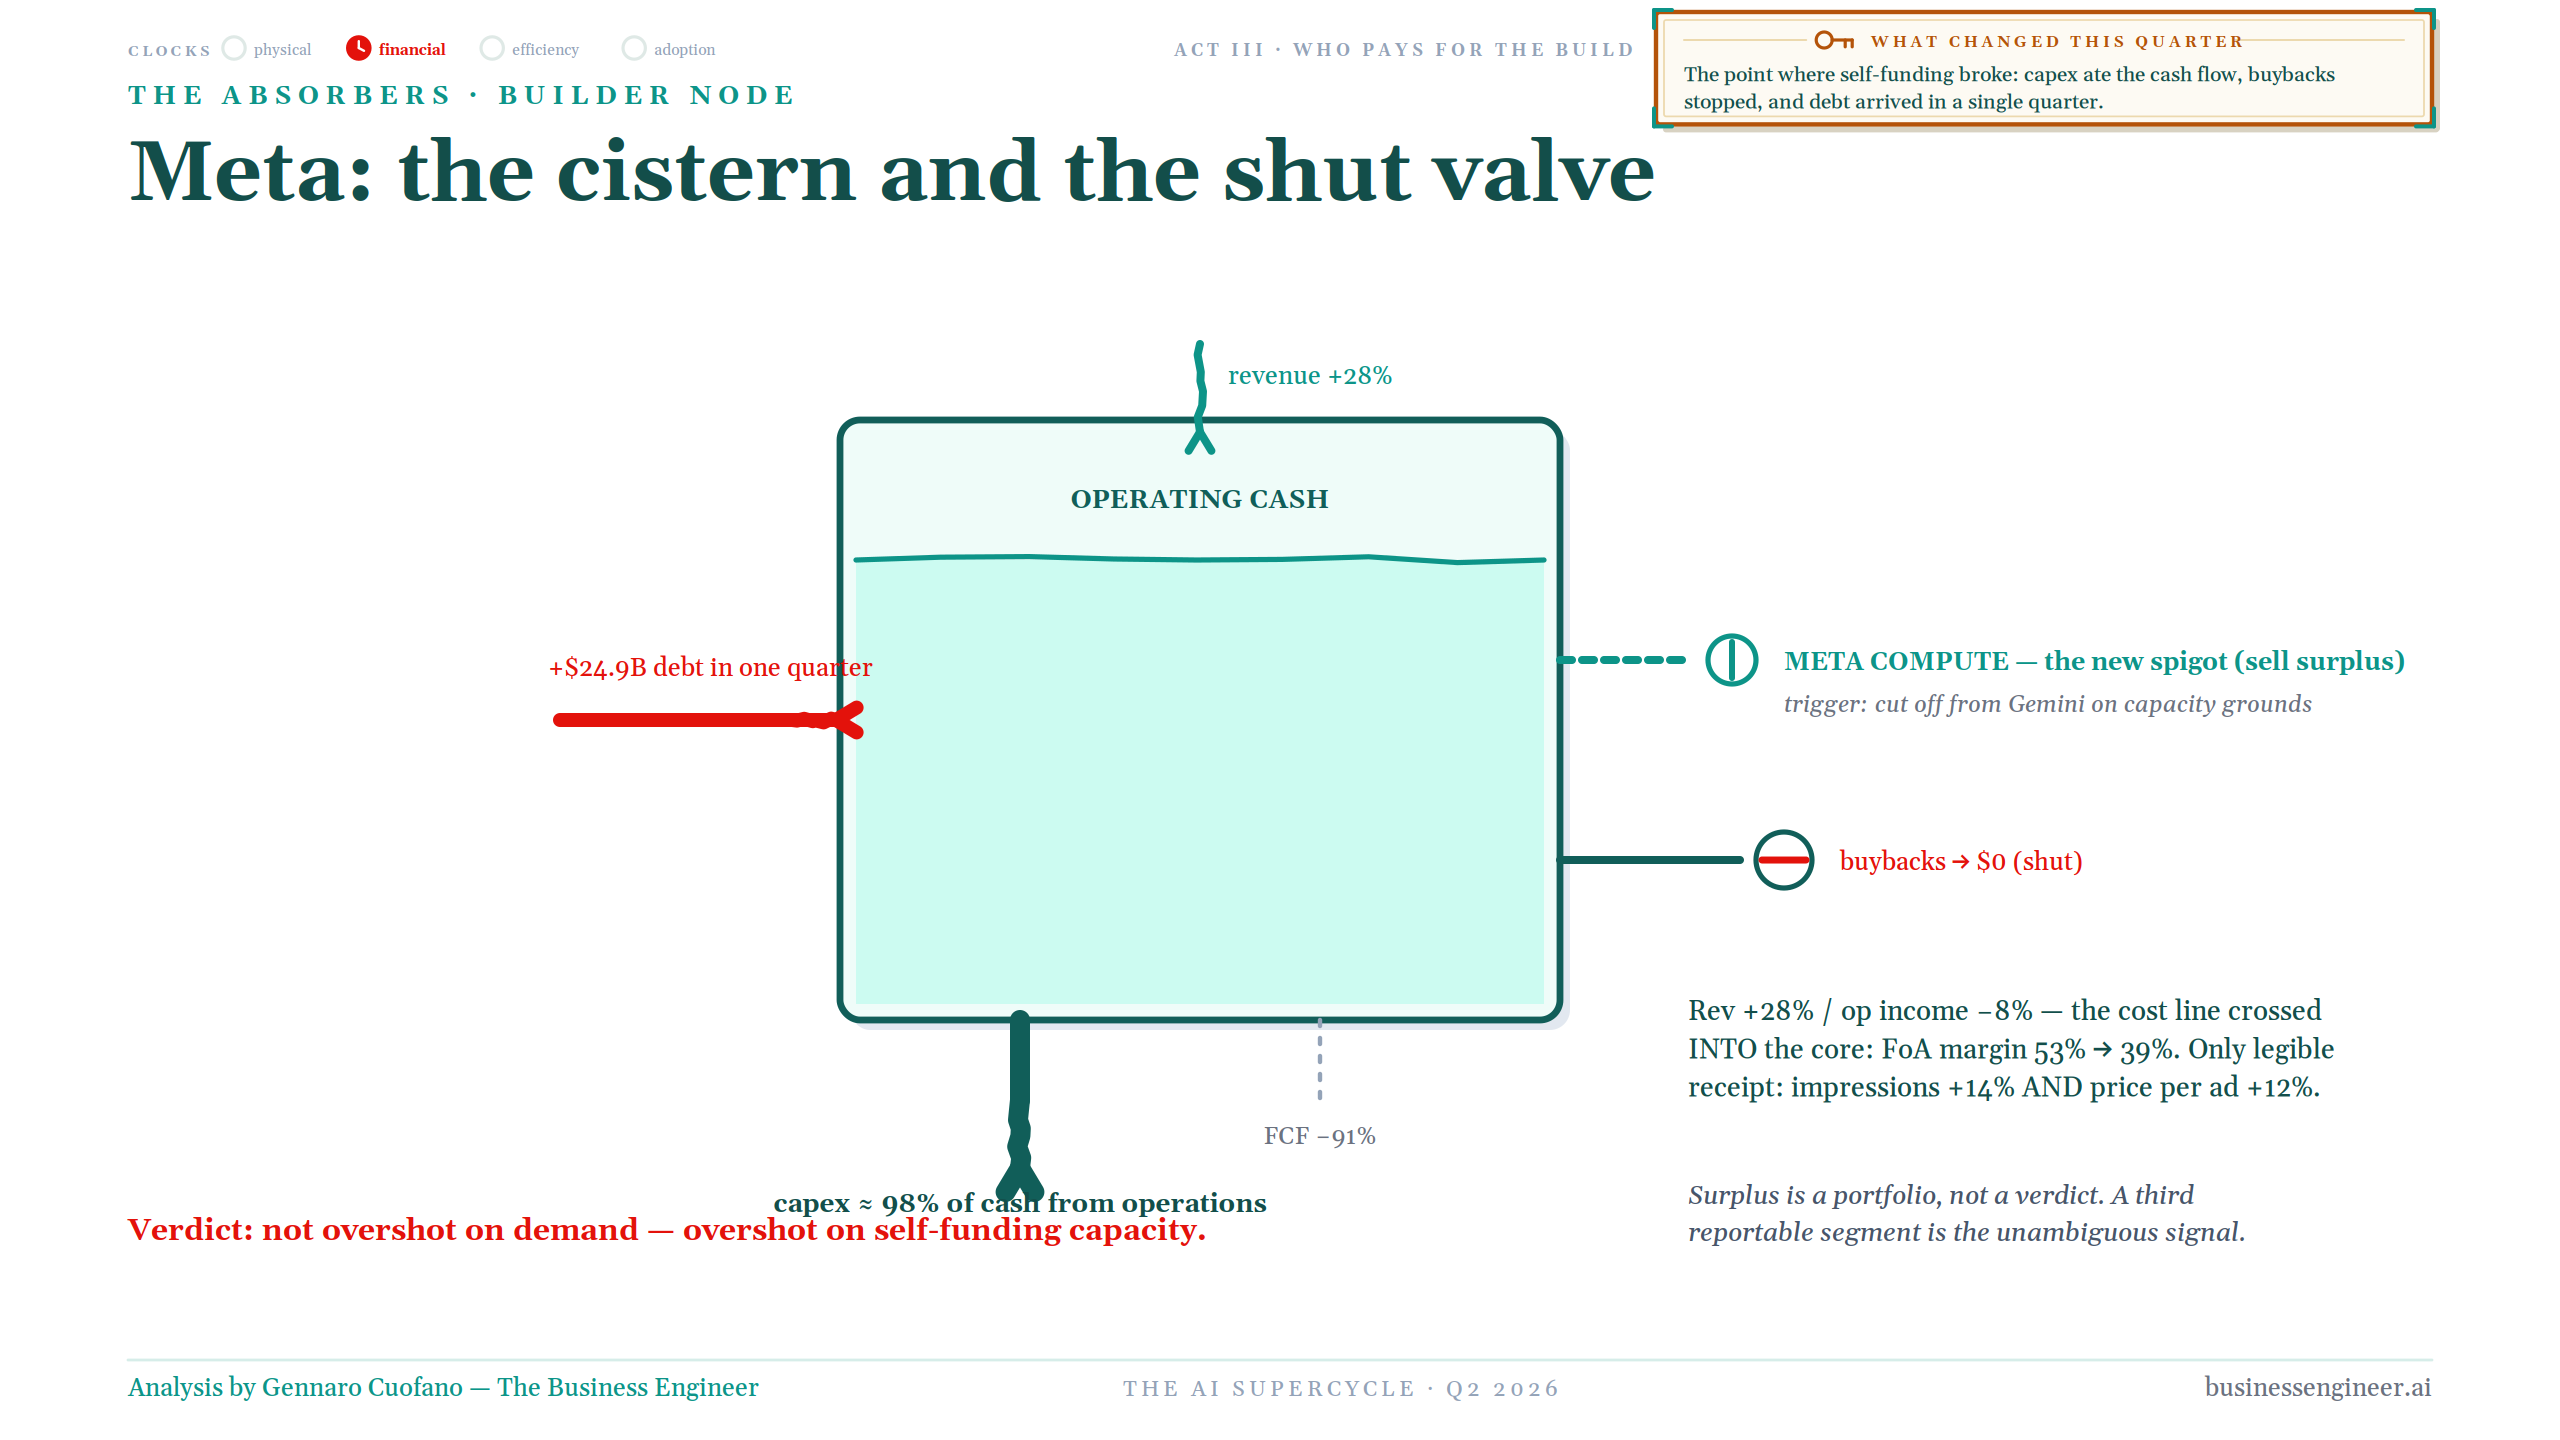
Meta is where self-funding visibly became more difficult. Revenue grew roughly 28%, but operating income moved the other way. Capex approached 98% of cash from operations. Free cash flow collapsed. Buybacks went to zero. And roughly $24.9 billion of debt arrived in a single quarter.
This is why I do not describe Meta as having overshot demand. The demand remains visible. What Meta overshot was its ability to self-fund the capacity required to serve it under the previous financial structure.
The distinction is fundamental. A company can be right about the technology and still arrive at the wrong capital structure.
Meta retains a shut valve. It can slow capacity. It can sell surplus. It can turn Meta Compute into an external spigot if Gemini or others need that capacity.
But the quarter marks the point where the financial clock entered the core.
Amazon: the split ledger
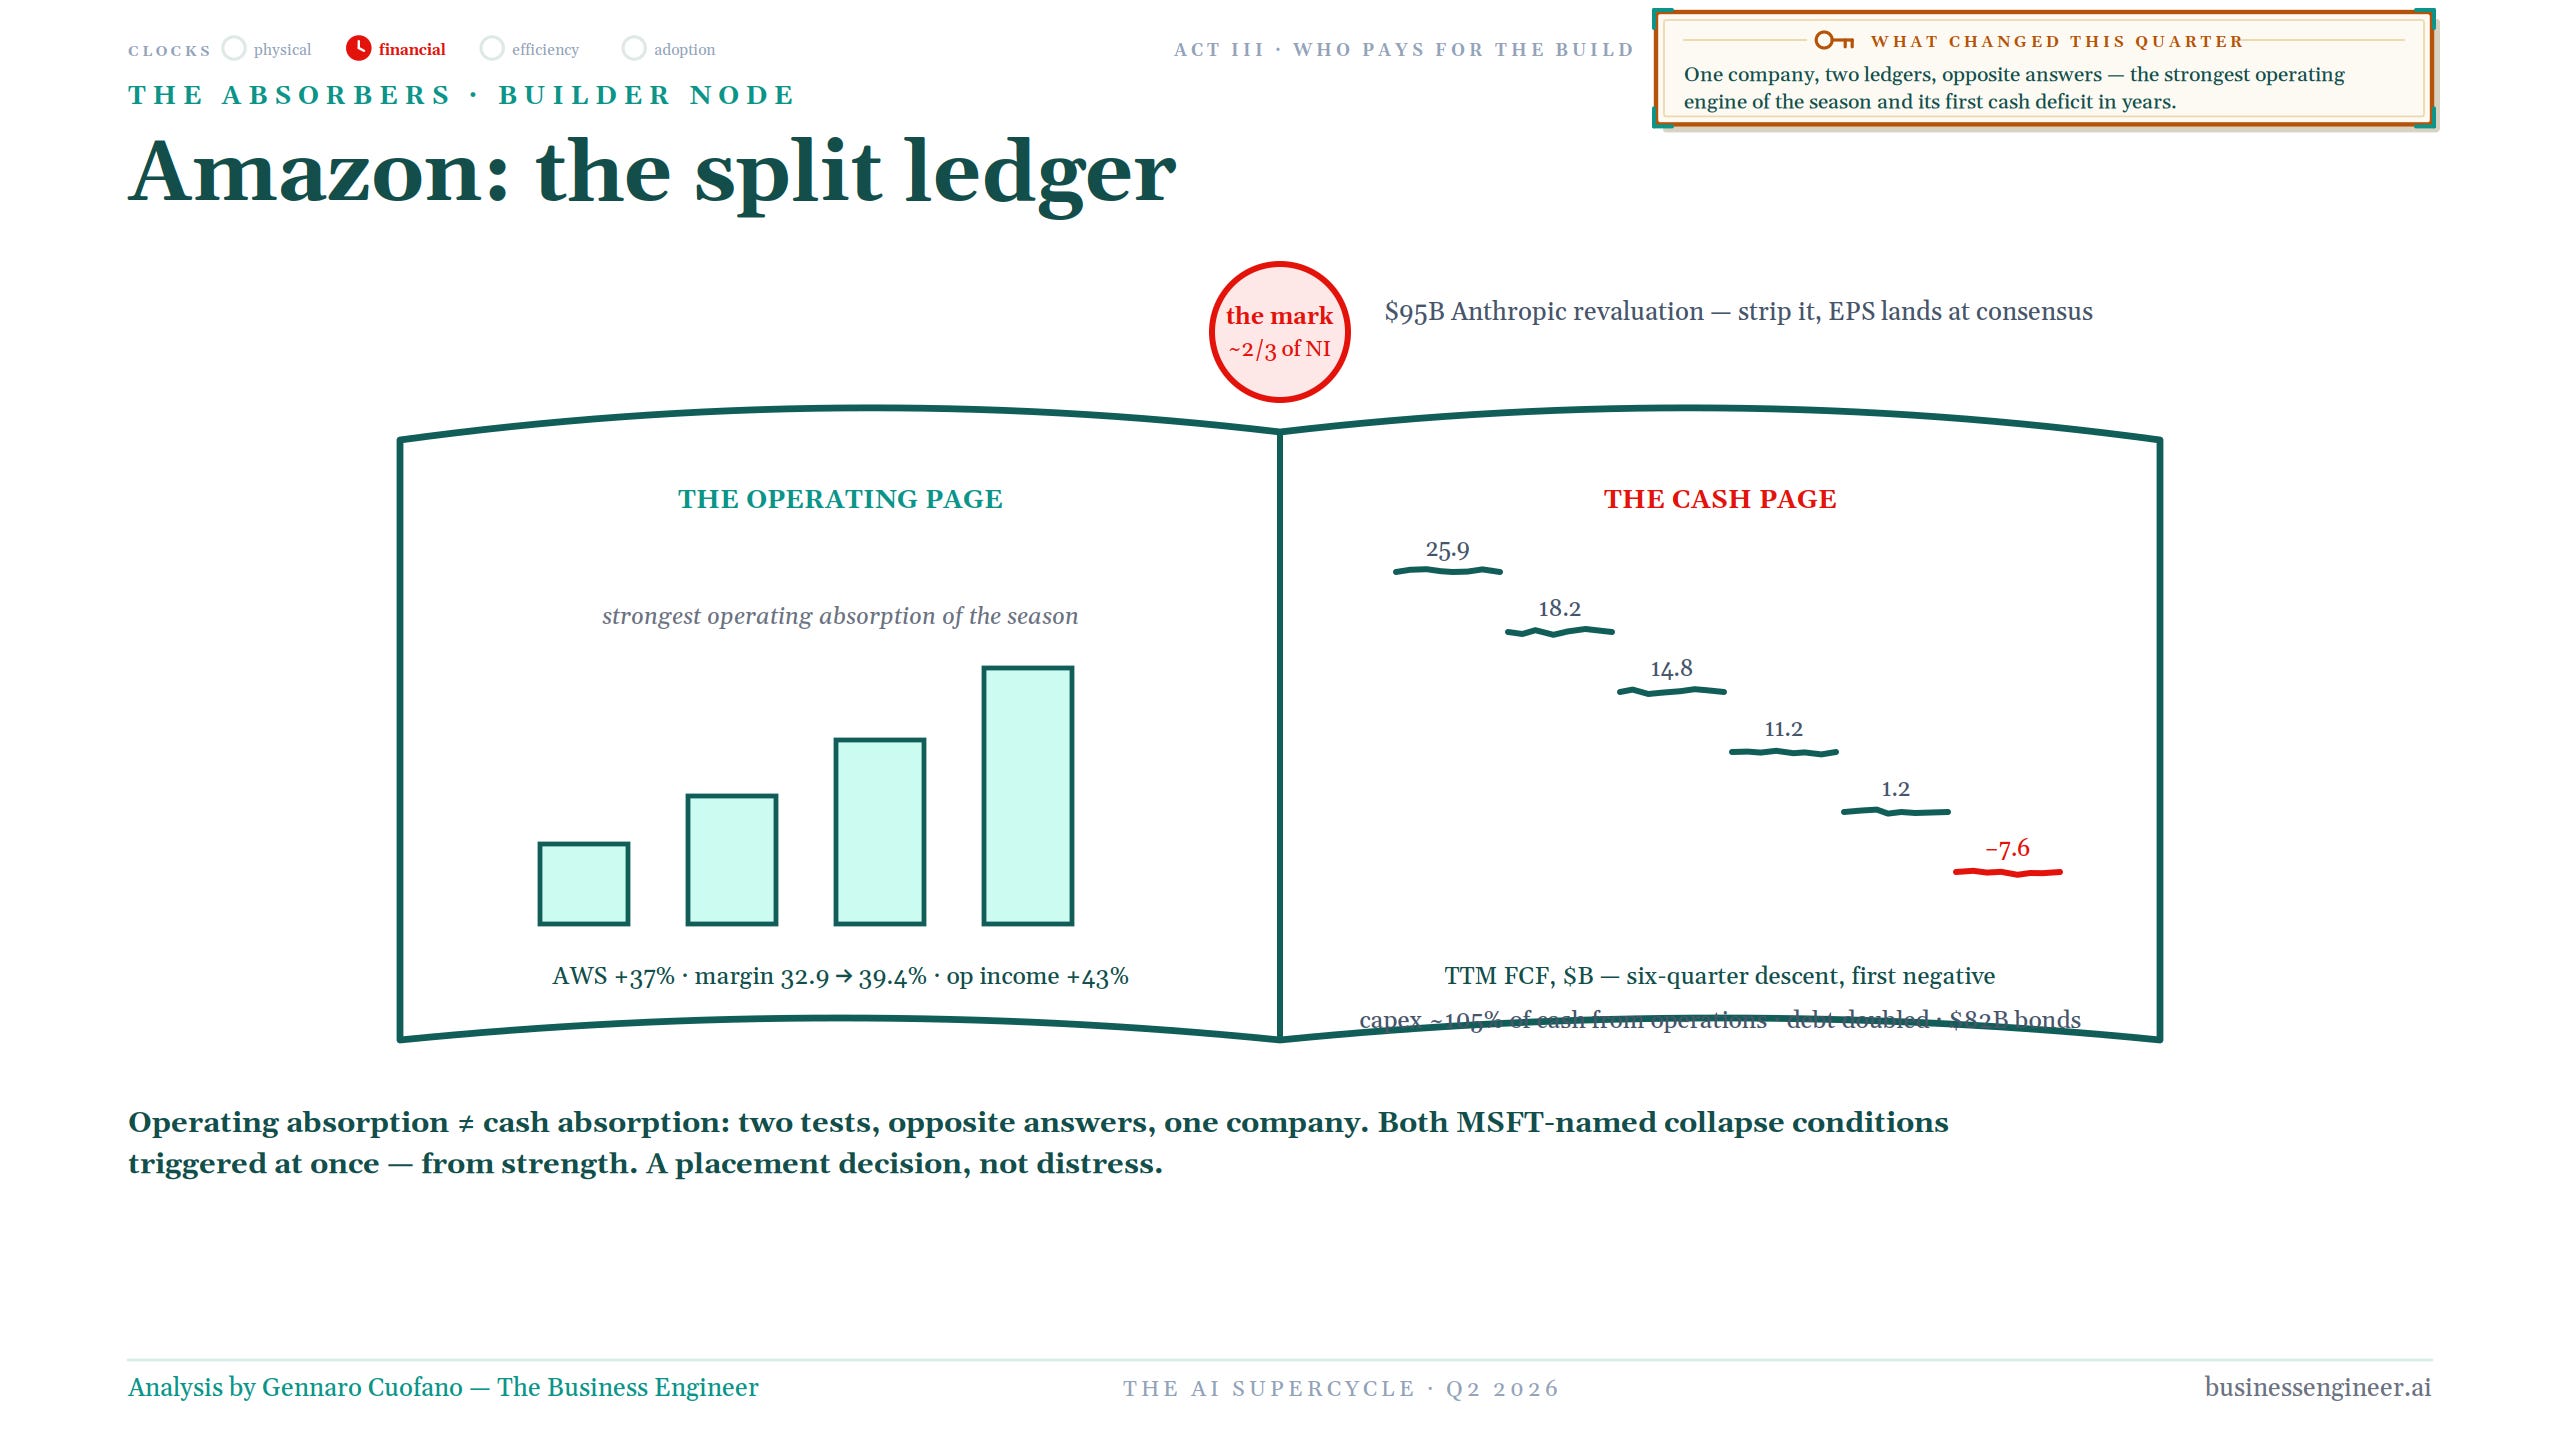
Amazon produces one of the cleanest examples of why operating economics and cash economics have to be read separately. The AWS operating page is exceptional: revenue growth around 37%, margin expansion from roughly 32.9% to 39.4%, operating income up about 43%.
Then turn the page. Trailing free cash flow descends quarter after quarter and eventually becomes negative, around -$7.6 billion in the framework.
Same company. Two opposite answers.
There is also an important distortion in reported earnings because Anthropic investment marks account for a significant portion of net income. Strip those away and the operating story remains strong, but much less spectacular.
That is not distress. It is placement. Amazon is strong enough to absorb the build operationally while simultaneously allowing the cash page to deteriorate.
Two houses beside the build
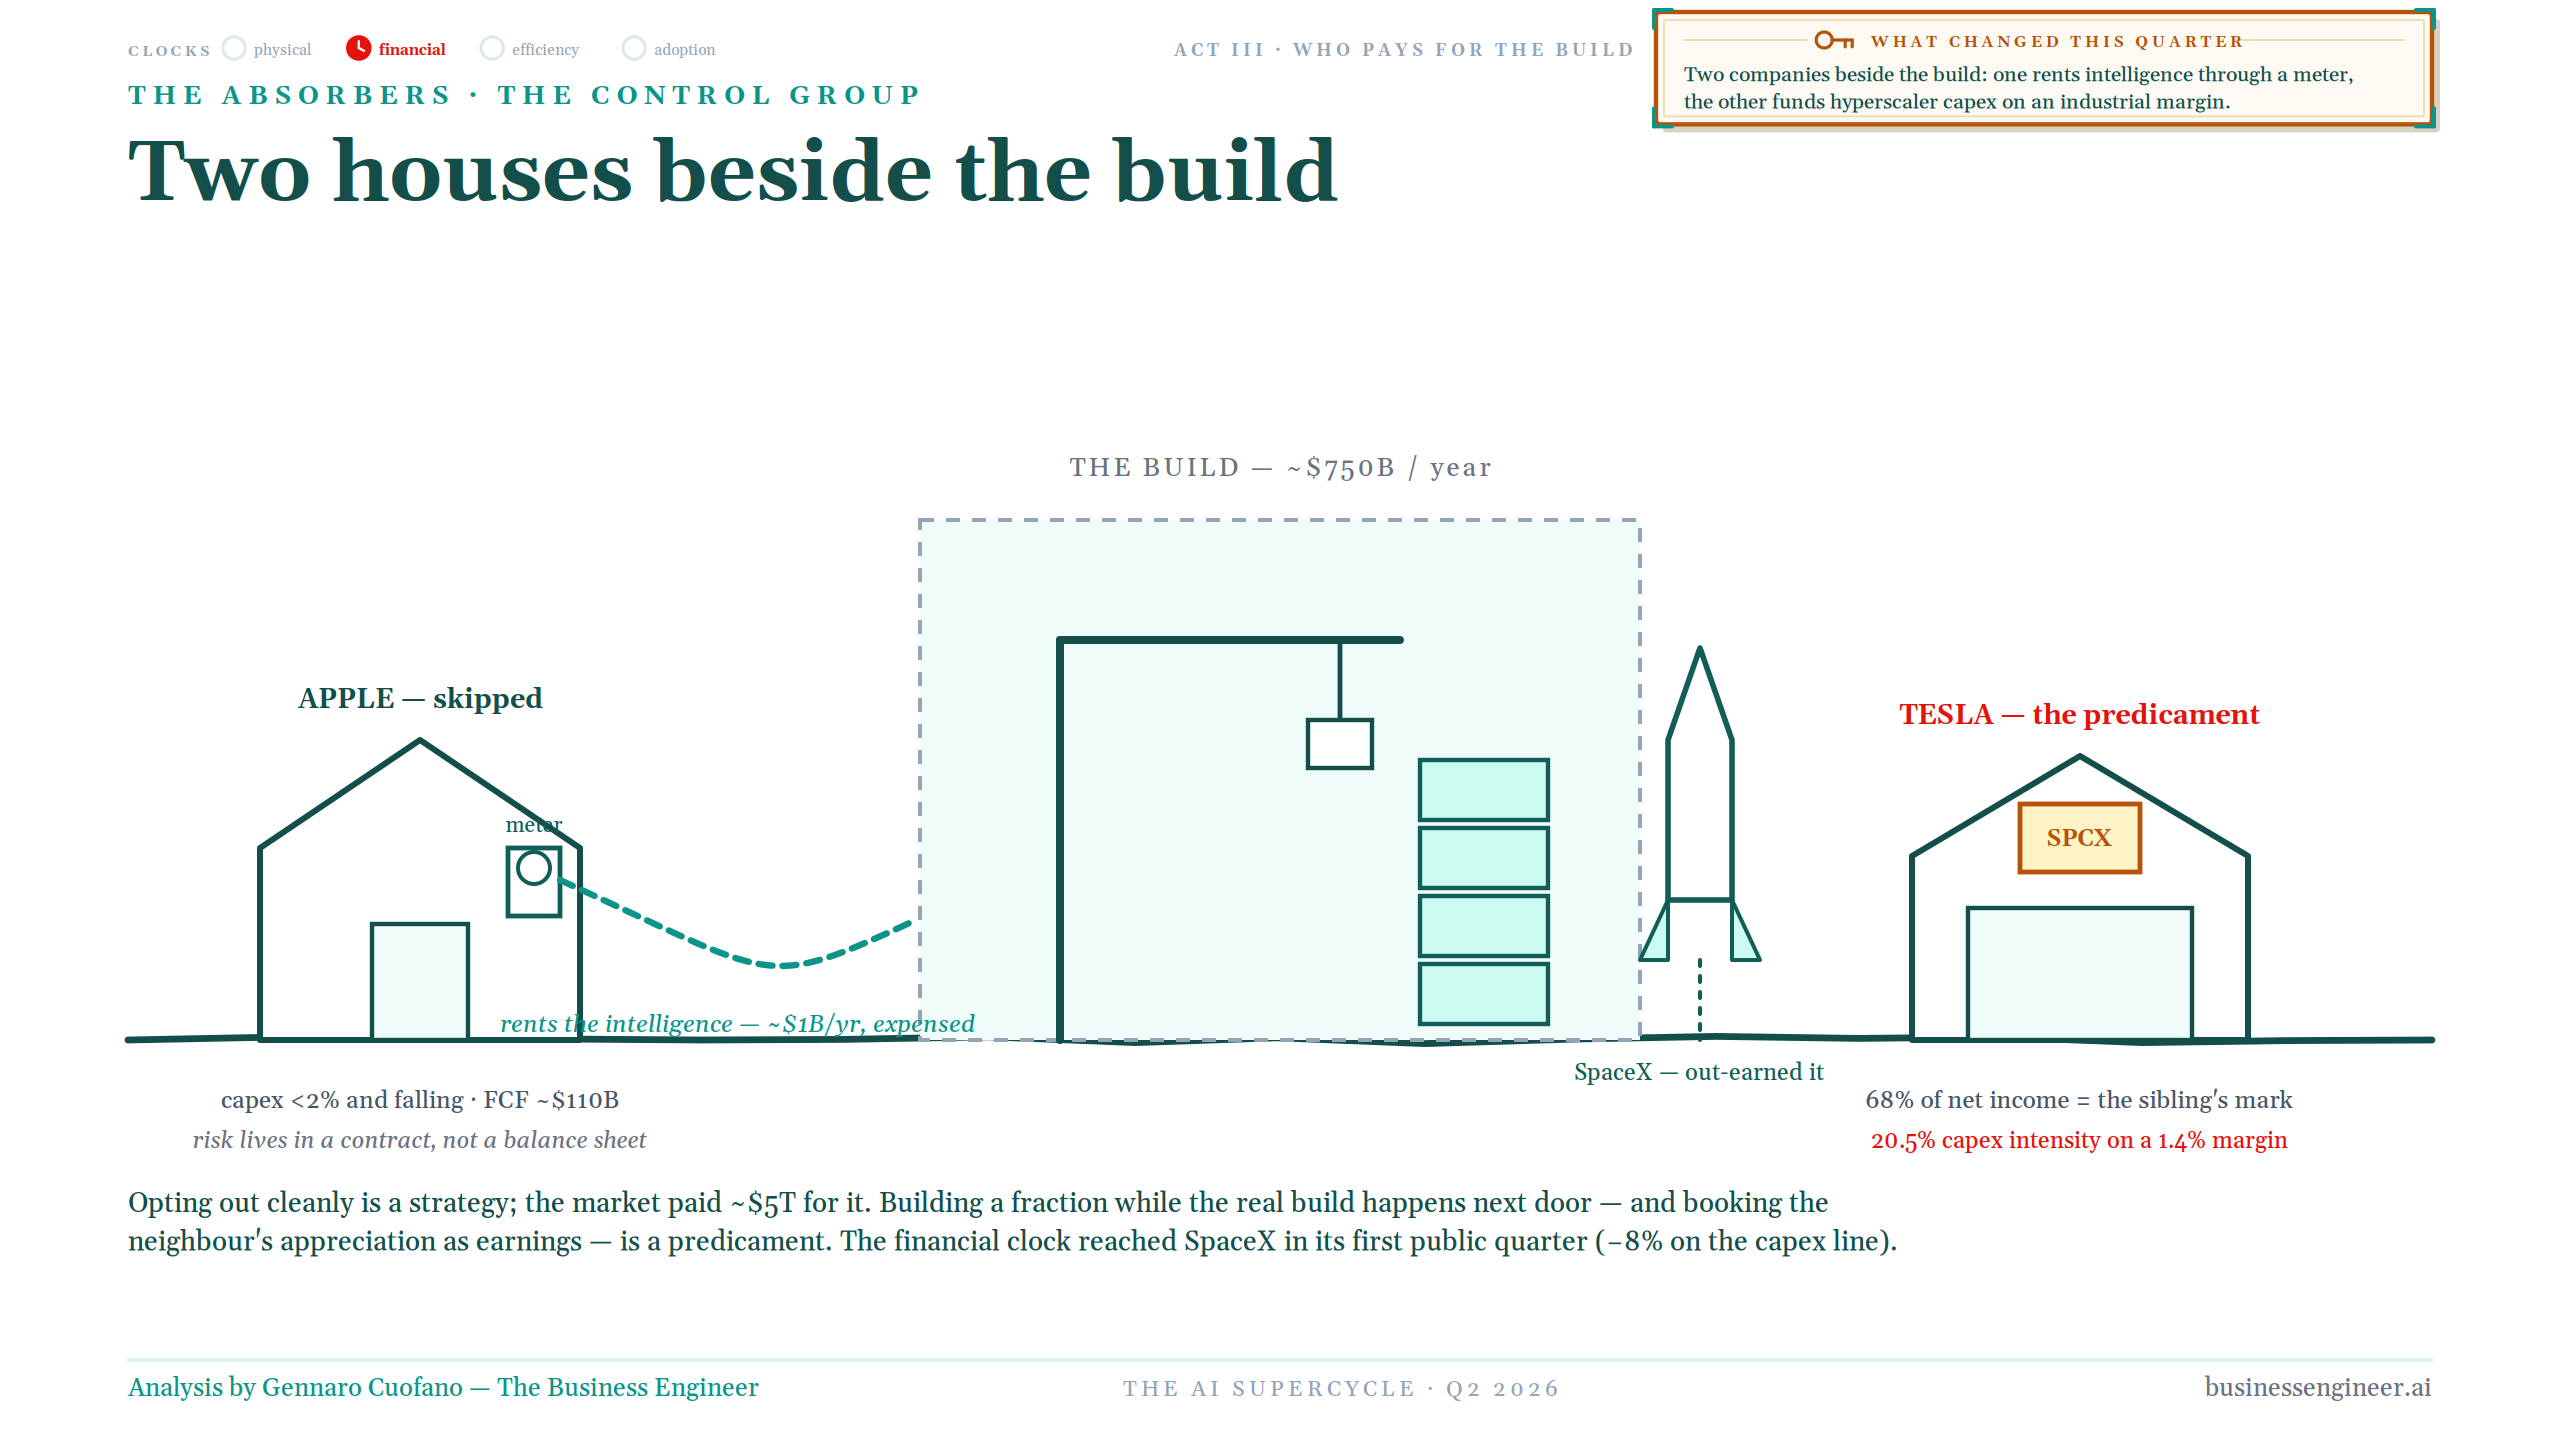
The control group may be even more interesting than the builders. Apple has largely skipped the physical arms race. Capex remains below roughly 2% and falling. Free cash flow is around $110 billion. Rather than internalizing the entire build, Apple can rent intelligence through a meter, spending on the order of a billion dollars a year and treating the risk as a contract rather than a balance-sheet commitment.
The market has valued that position at roughly $5 trillion. That is worth remembering.
Opting out cleanly is a strategy.
Tesla illustrates the opposite predicament. It sits beside a gigantic neighboring build while running about 20.5% capex intensity on roughly a 1.4% margin, and a remarkable share of reported earnings comes from the mark on its sibling.
The distinction is brutal. Apple rents the infrastructure. Tesla is financially exposed to the appreciation of a nearby infrastructure machine while building on industrial economics. And the sibling, SpaceX, has already out-earned it.
The SpaceX flywheel
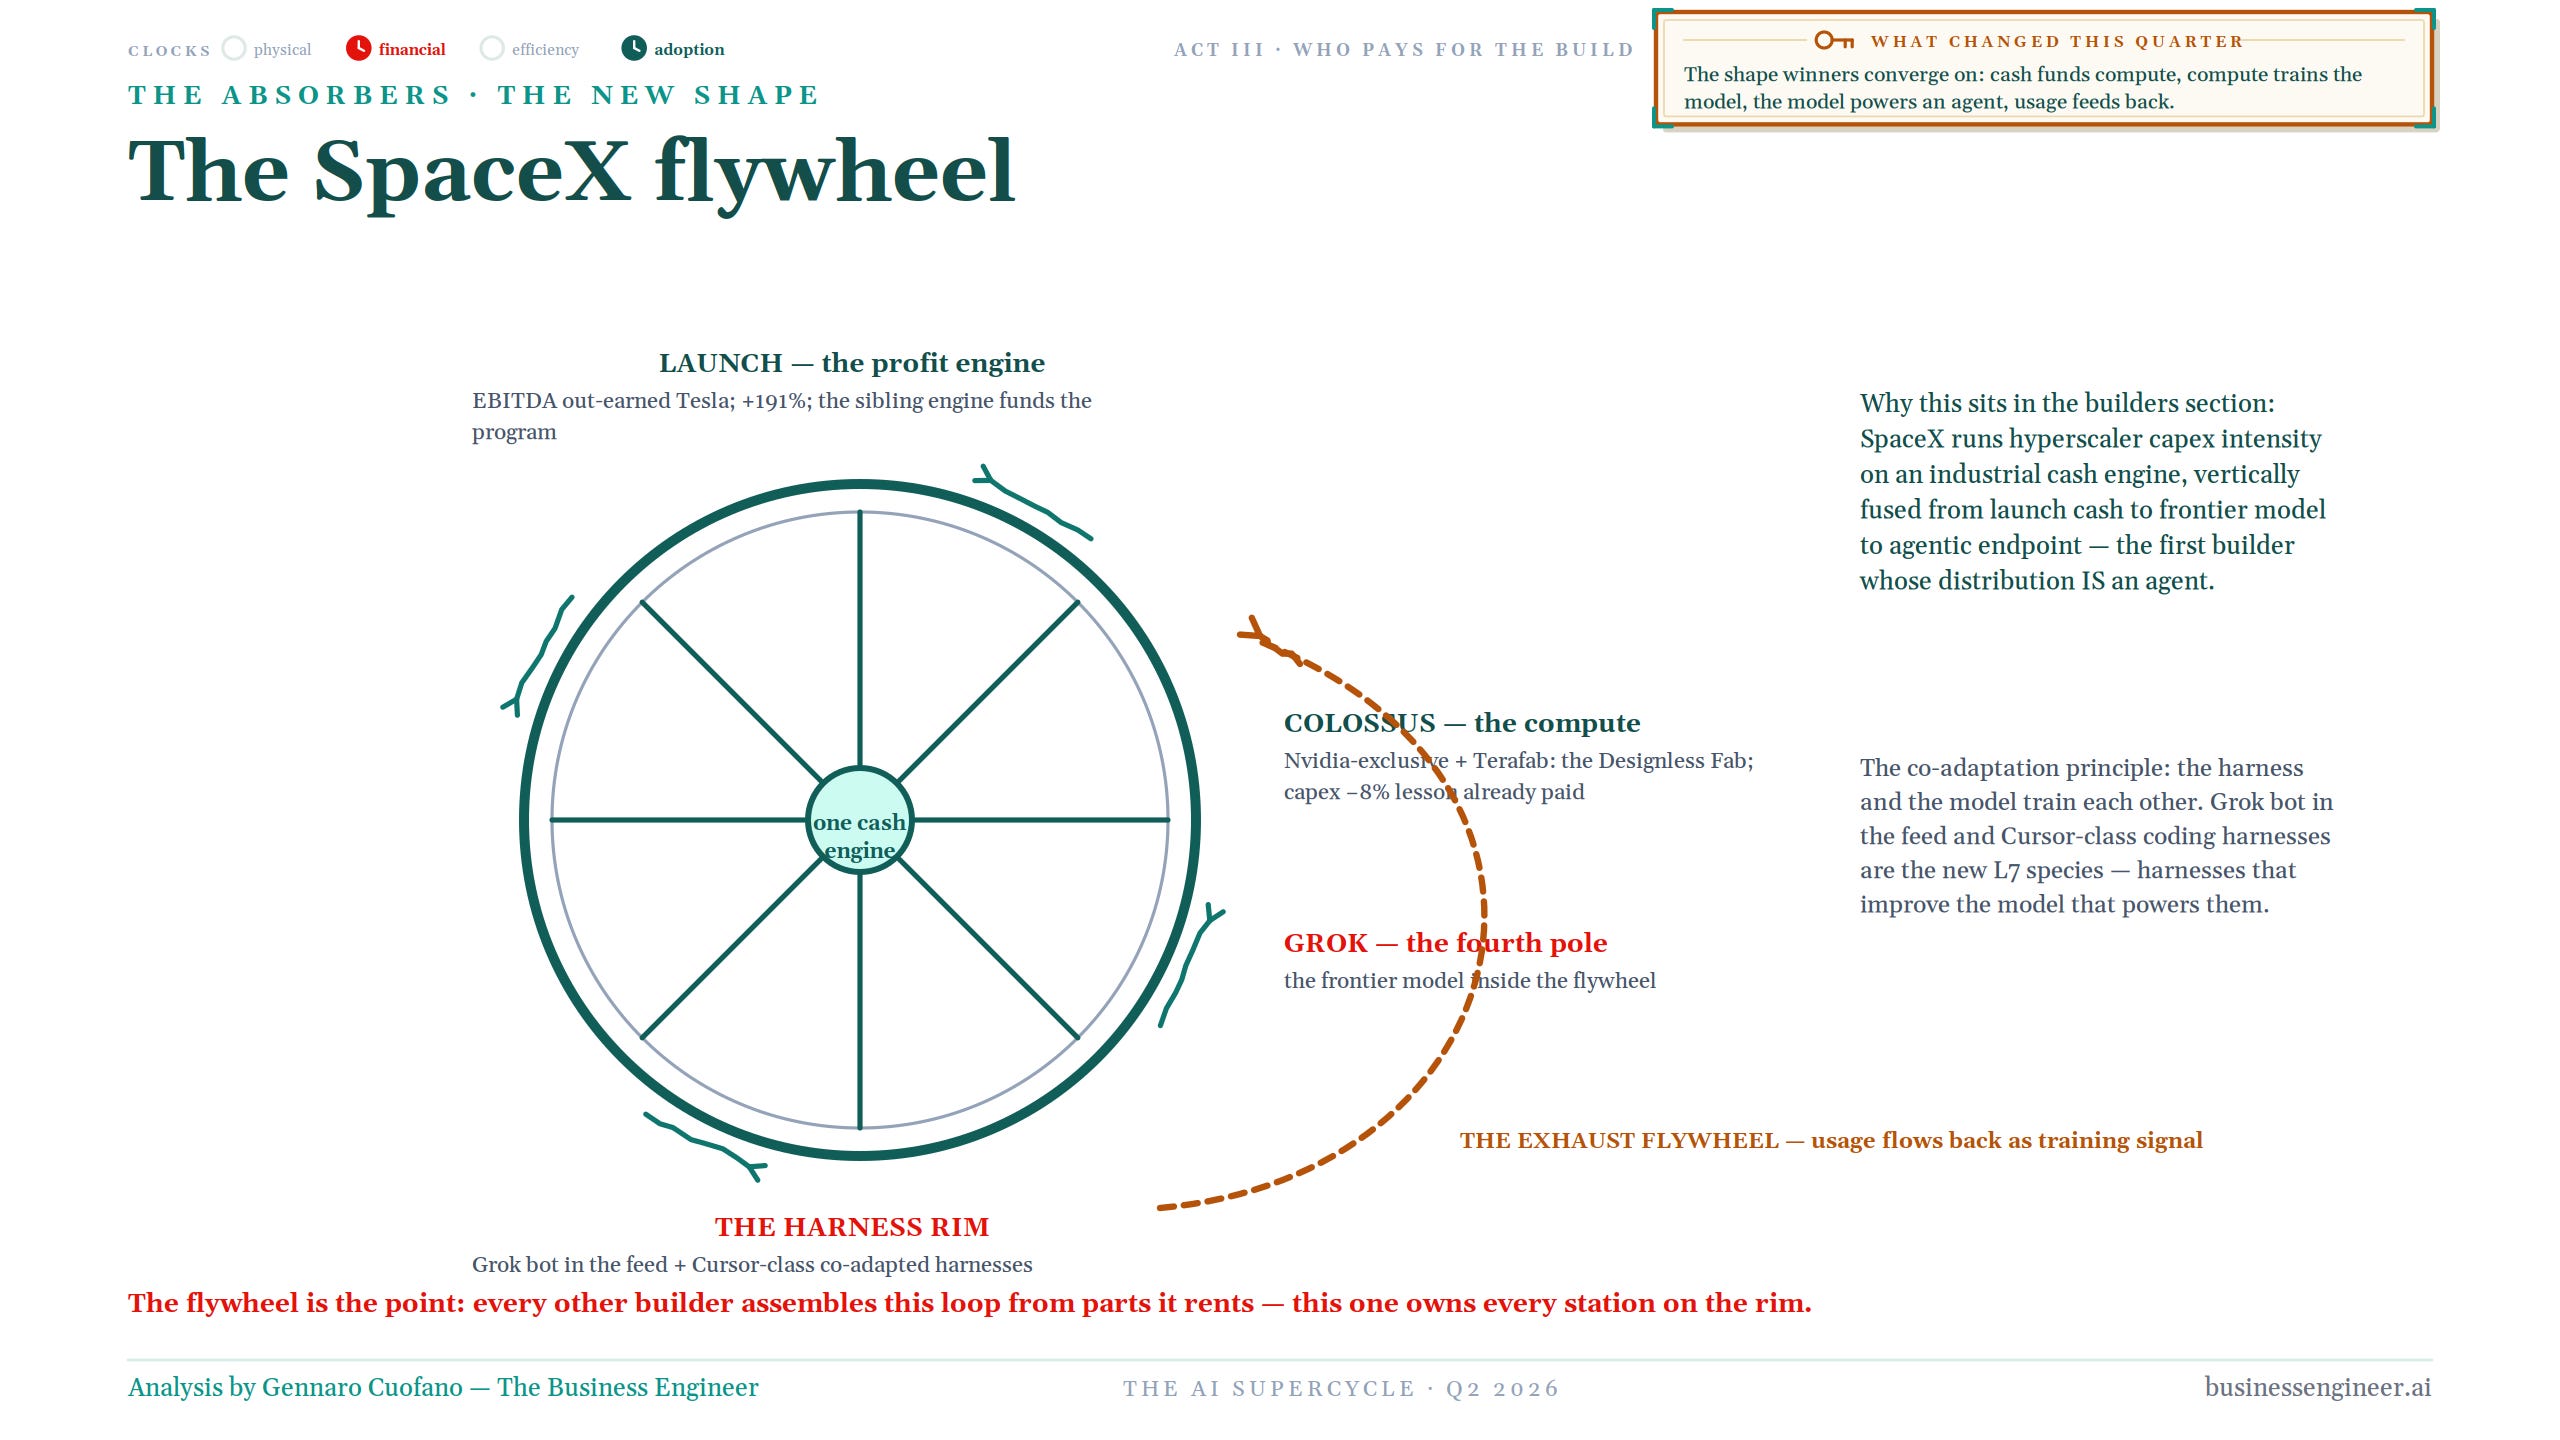
SpaceX deserves its own category because it reveals an economic structure toward which several winners may ultimately converge. The flywheel begins with launch as the cash-generating engine. Alongside it sits Colossus as the compute engine. Compute trains Grok as the model. The model powers the harness, increasingly embedded in distribution and coding workflows. Then the exhaust returns: usage becomes training signal.
This should be read as an economic flywheel, not a literal treasury waterfall. The point is that the same corporate system increasingly owns the cash engine, compute, model, distribution and usage feedback loop.
Most builders assemble pieces of this loop from infrastructure they rent. SpaceX increasingly owns more of the stations around the loop itself.
This matters because the vertical-integration advantage is not simply cost. It is co-adaptation. The model changes the harness; the harness changes how the model is used; usage changes the model again.
The flywheel is the product.
Follow one dollar of capex
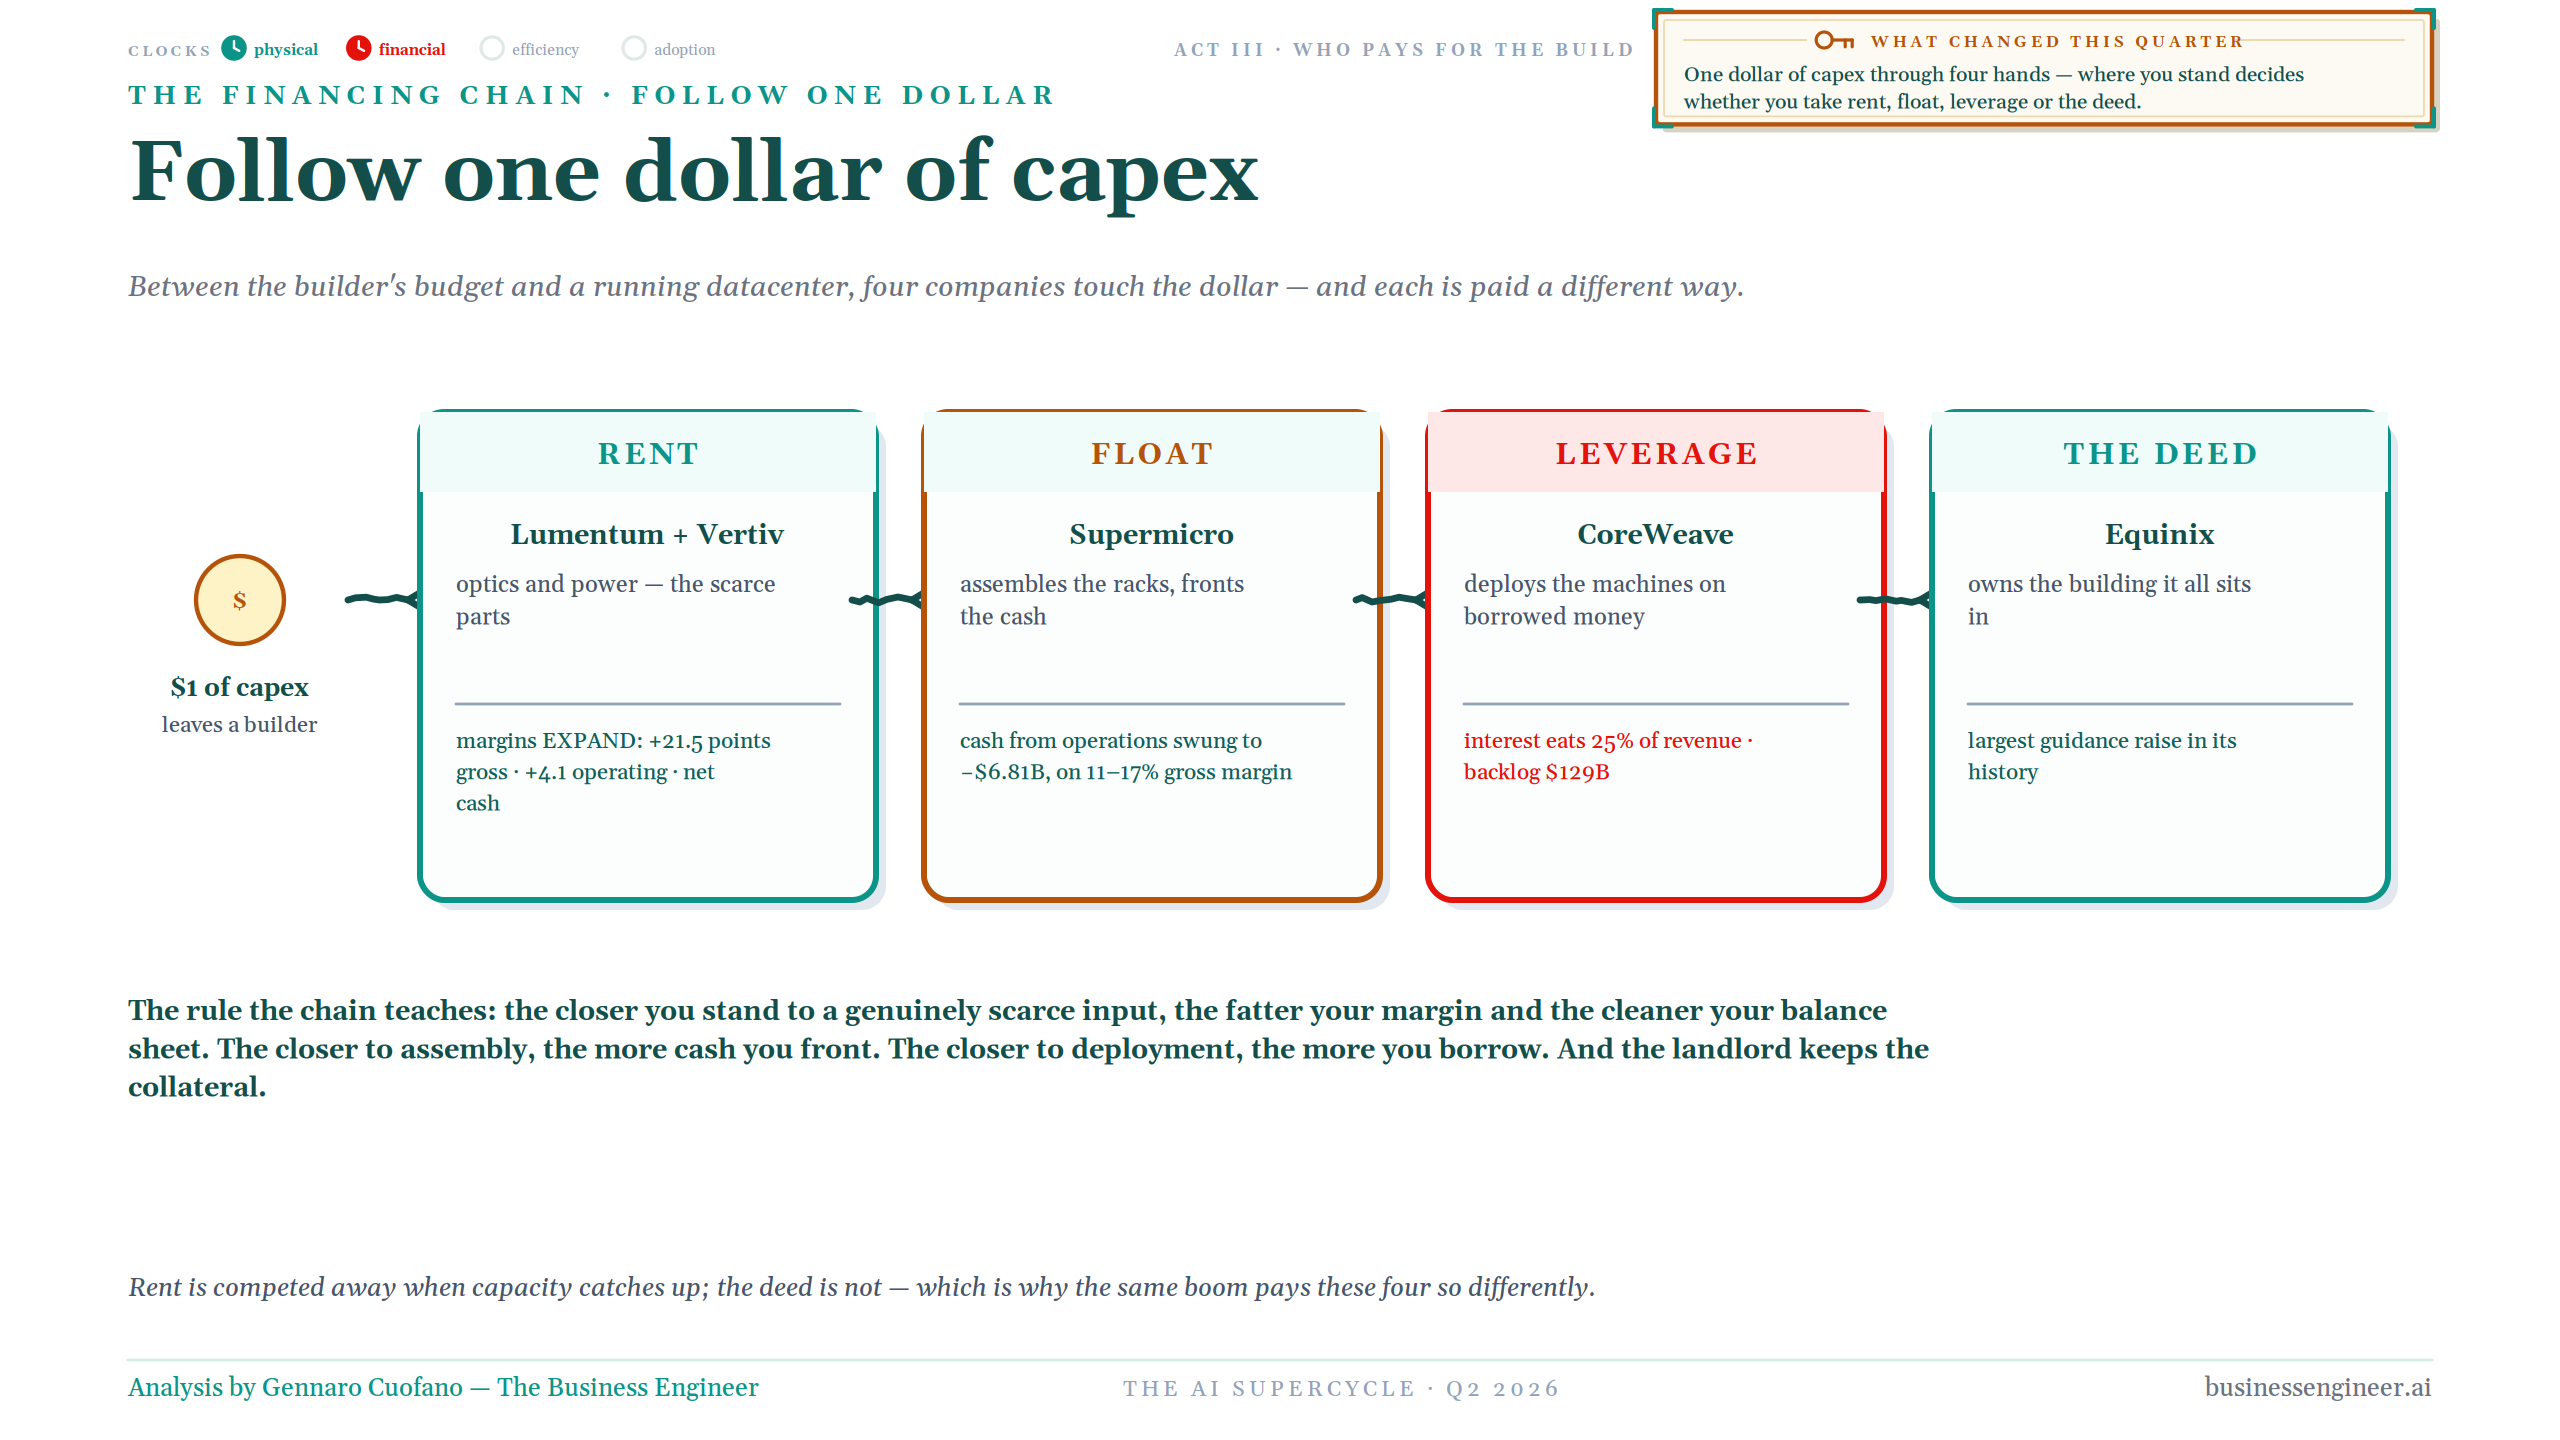
Now follow one dollar from the builder’s budget until it becomes a running data center. Different companies touch that dollar, and they are paid in radically different ways.
Lumentum and Vertiv collect rent because optics and power are scarce. Margins expand and balance sheets remain comparatively clean. Supermicro carries the float. It assembles the racks and fronts enormous amounts of working capital while operating on much thinner gross margins. CoreWeave carries the leverage. It deploys machines with borrowed money; interest expense approaches a quarter of revenue against an enormous backlog. Equinix keeps the deed. It owns the building underneath the whole arrangement.
There is a structural rule here. The closer you sit to a genuinely scarce input, the fatter the margin and cleaner the balance sheet. The closer you sit to assembly, the more cash you front. The closer you sit to deployment, the more you borrow. And the landlord keeps the collateral.
Rent can be competed away once capacity catches up. The deed cannot.
Same build, opposite balance-sheet sign
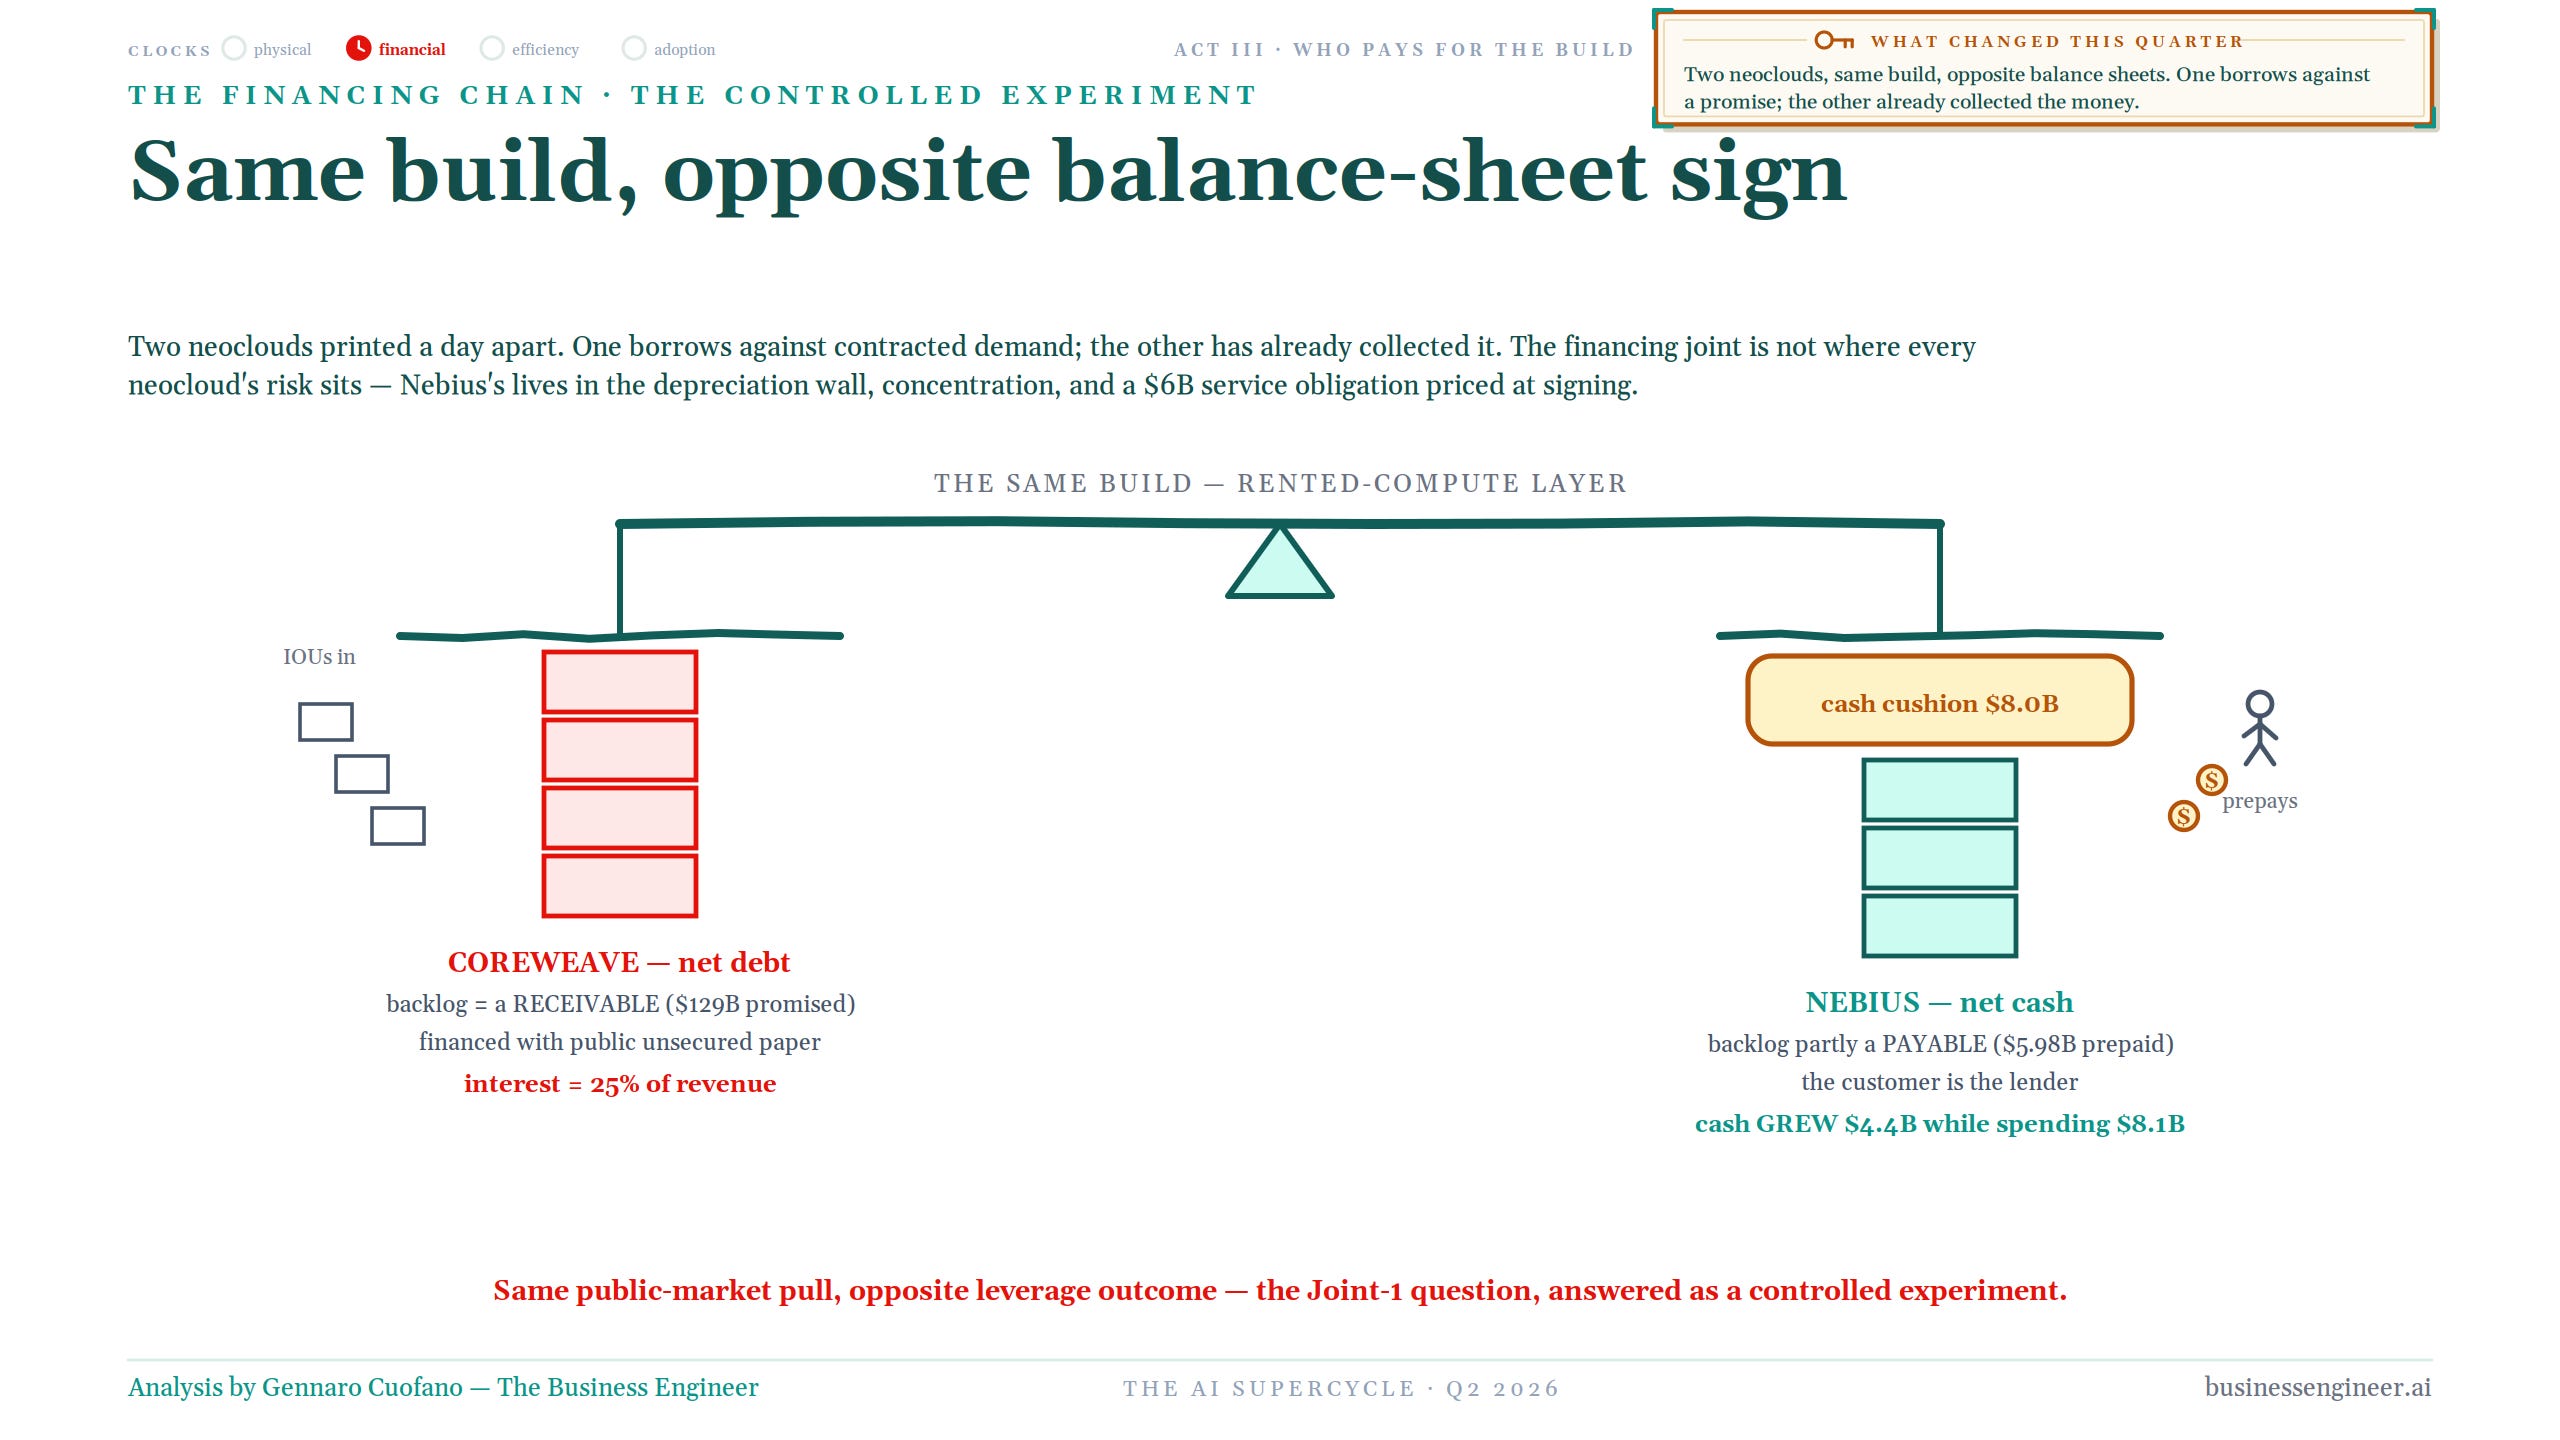
CoreWeave and Nebius then give us an almost controlled experiment. Same broad market. Same rented-compute layer. Opposite financing sign.
CoreWeave carries net debt against a contracted backlog of roughly $129 billion. That backlog represents future customer payments rather than cash already collected, while the capacity has to be financed today through public and private capital. Interest expense is roughly 25% of revenue.
Nebius is different. It sits on net cash and a substantial liquidity cushion because part of its future service obligation has effectively already been funded by the customer. Roughly $5.98 billion of customer prepayments turns the customer into a source of financing.
CoreWeave finances today against future customer commitments. Nebius has already collected part of the money.
The risk does not disappear for Nebius. It migrates into customer concentration, depreciation and the obligation to deliver future compute. But the balance-sheet sign is fundamentally different.
And CoreWeave gave us something even more useful: the first live test of one of the financing joints beneath the cycle. GPU-backed private credit reached a refinancing moment. It did not crack. Financing migrated into syndicated and public unsecured markets.
The joint survived. The risk changed owners.
The House of Morgan
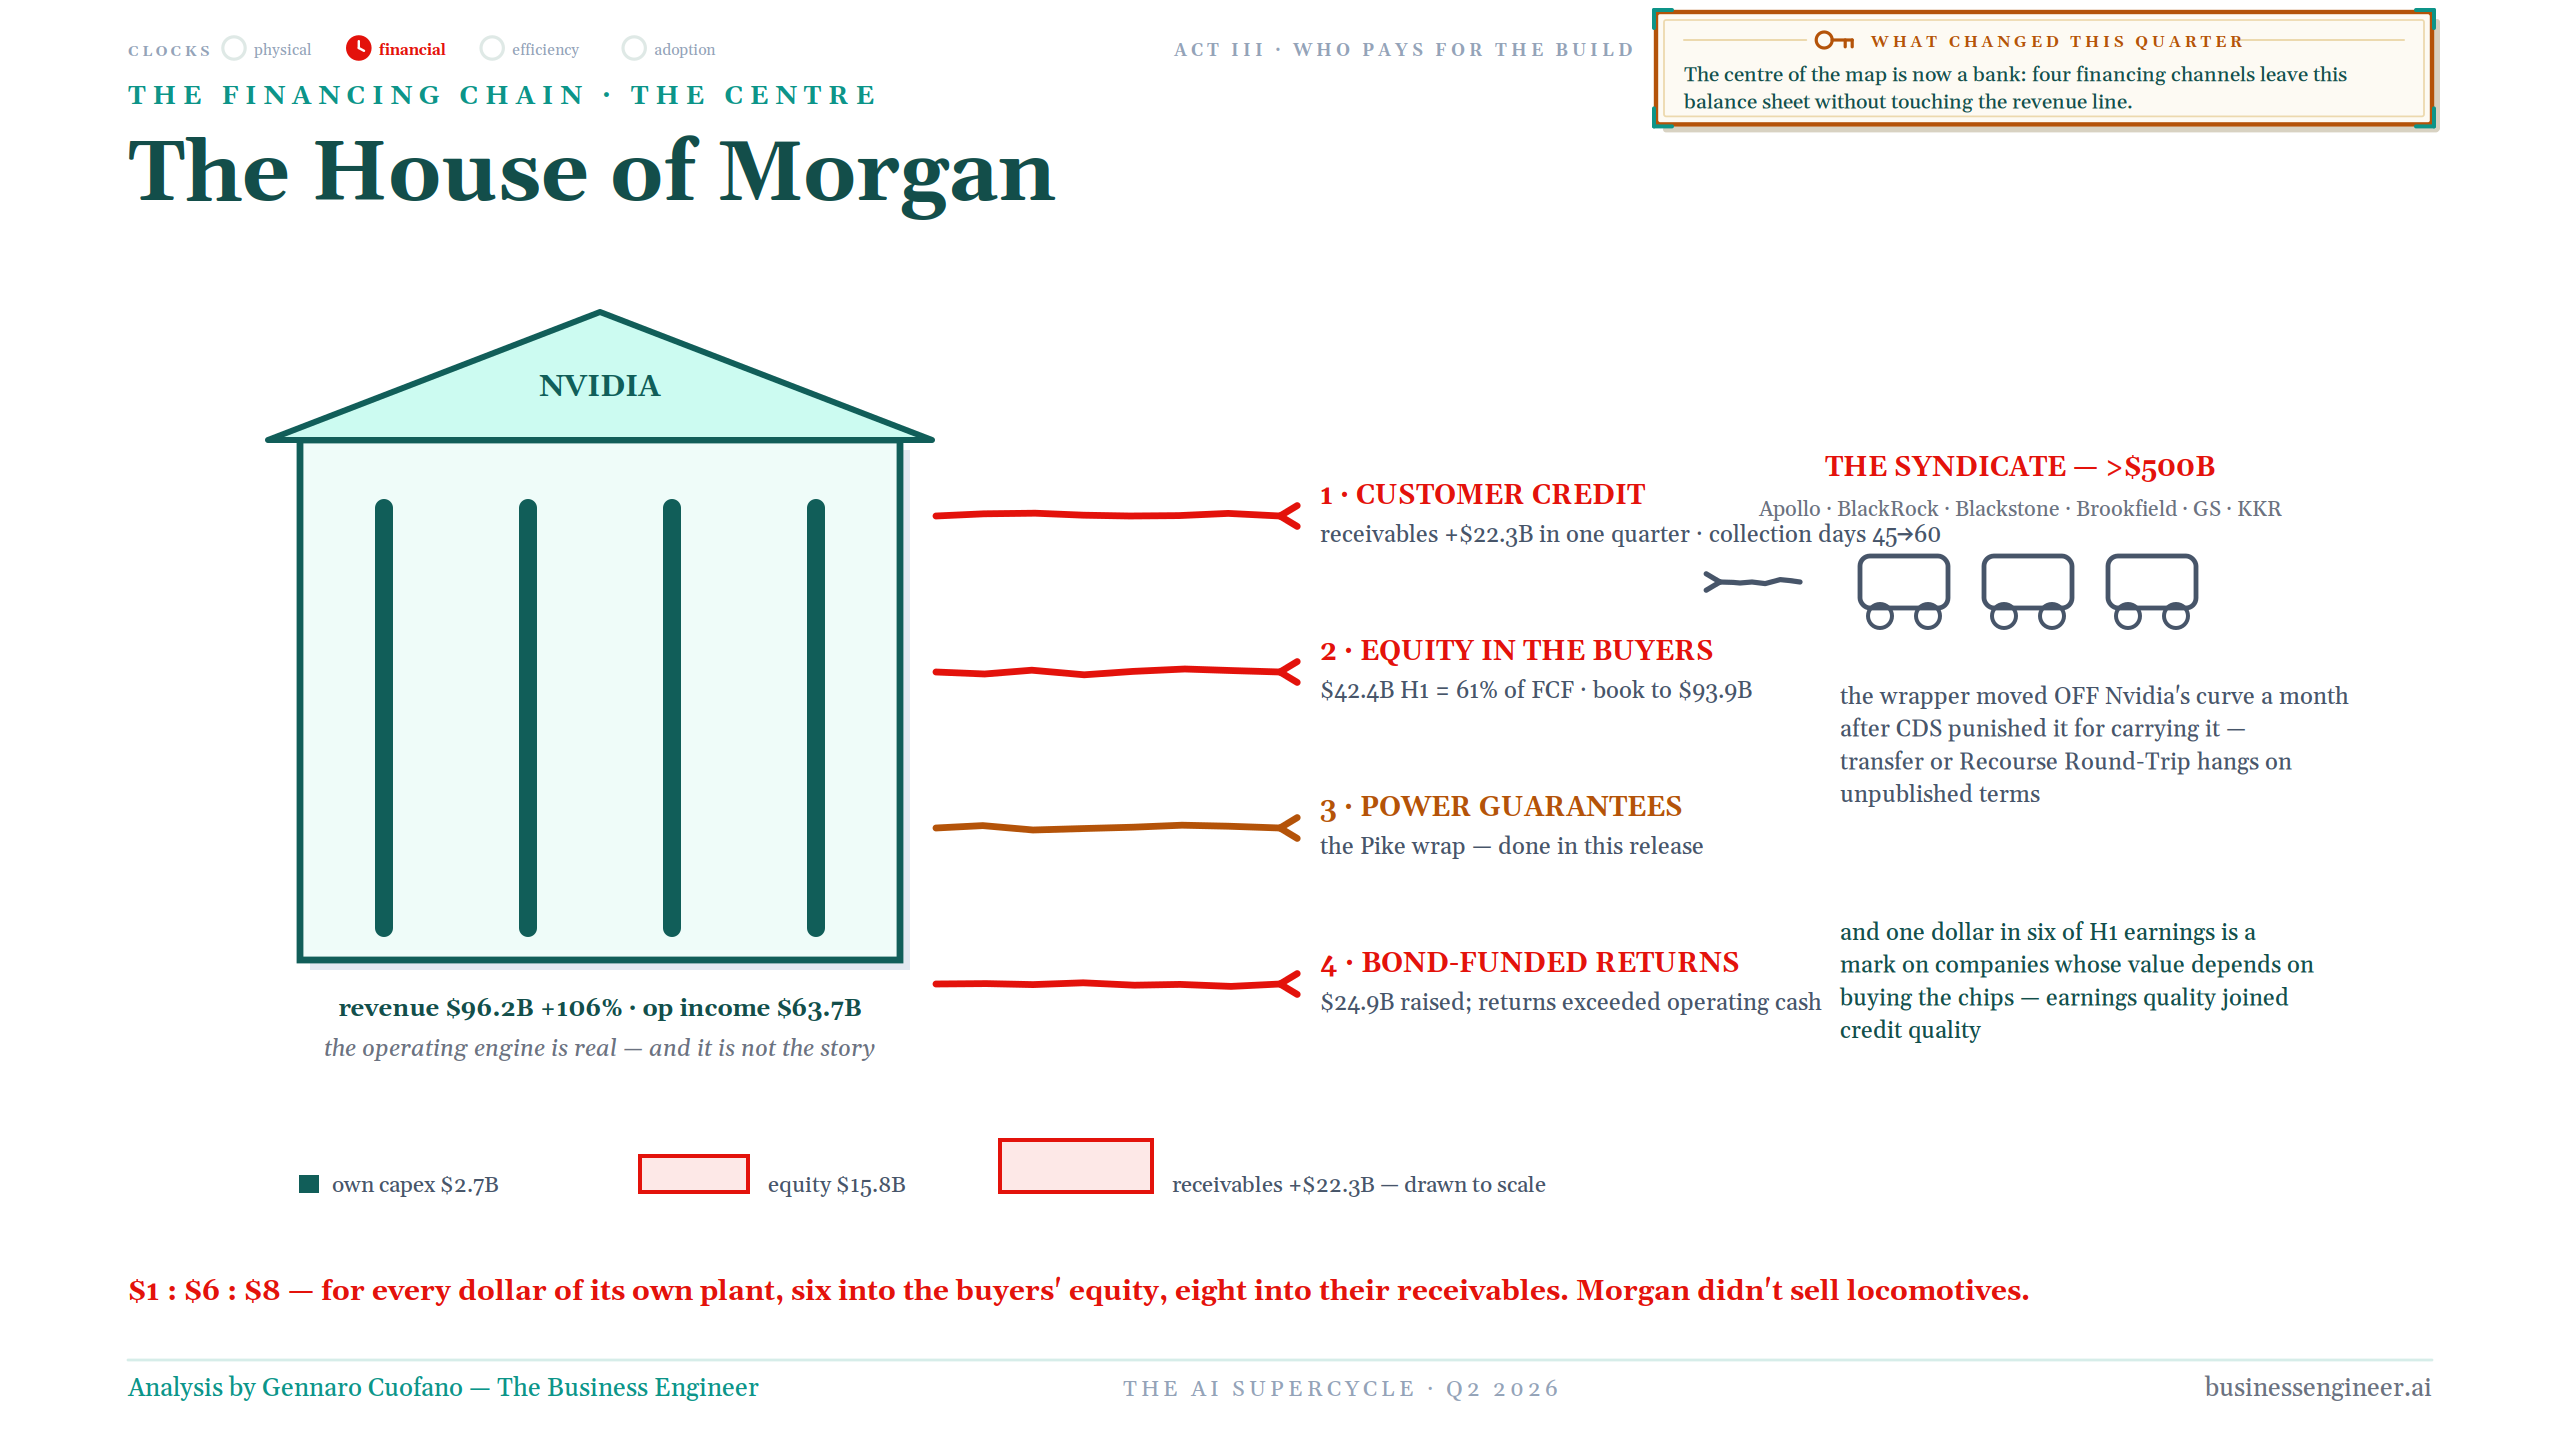
And then NVIDIA printed. Until this quarter, NVIDIA could still be described primarily as the purest beneficiary of the AI build. The builders spent. NVIDIA got paid.
That description is now incomplete.
The operating engine remains extraordinary: roughly $96.2 billion of revenue, +106%, and $63.7 billion of operating income in the latest print. But the operating engine is not the discovery. The balance sheet is.
NVIDIA increasingly helps finance the ecosystem buying its products through four channels. First, customer credit: receivables expanded sharply, while collection days moved higher. Second, equity investments in buyers and adjacent infrastructure companies: the investment book has grown materially, leaving NVIDIA with direct economic exposure to companies whose success depends in part on continuing to build AI infrastructure.
Third, power and infrastructure support, where guarantees and related structures can pull NVIDIA deeper into the physical build required to operate its chips. Fourth, capital-market structures around the ecosystem, as a widening syndicate of private-capital institutions finances the data centers, power assets and compute companies sitting around the GPU.
Put the geometry together and the change becomes visible. NVIDIA is no longer merely supplying the critical equipment. The supplier is extending credit into the ecosystem, owning pieces of companies that consume the equipment, and helping support the infrastructure required to use it.
This is why the railway analogy becomes more than historical color.
NVIDIA is increasingly playing the House of Morgan role in the AI build: not only supplying the critical equipment, but helping finance the ecosystem buying it.
The analogy should not be taken literally. Morgan reorganized and financed railroads; NVIDIA manufactures the locomotives of this system as well. That makes the structure, if anything, more unusual: supplier and financier are increasingly sitting on the same economic map.
And the financial wrapper around the build is widening. Hundreds of billions of dollars of institutional capital now sit around the system through Apollo, BlackRock, Blackstone, Brookfield, Goldman Sachs, KKR and others. Whether those structures genuinely distribute risk or merely move the same exposure farther from the original supplier depends on terms that remain only partially observable.
But the center has moved.
The beat raises the hurdle
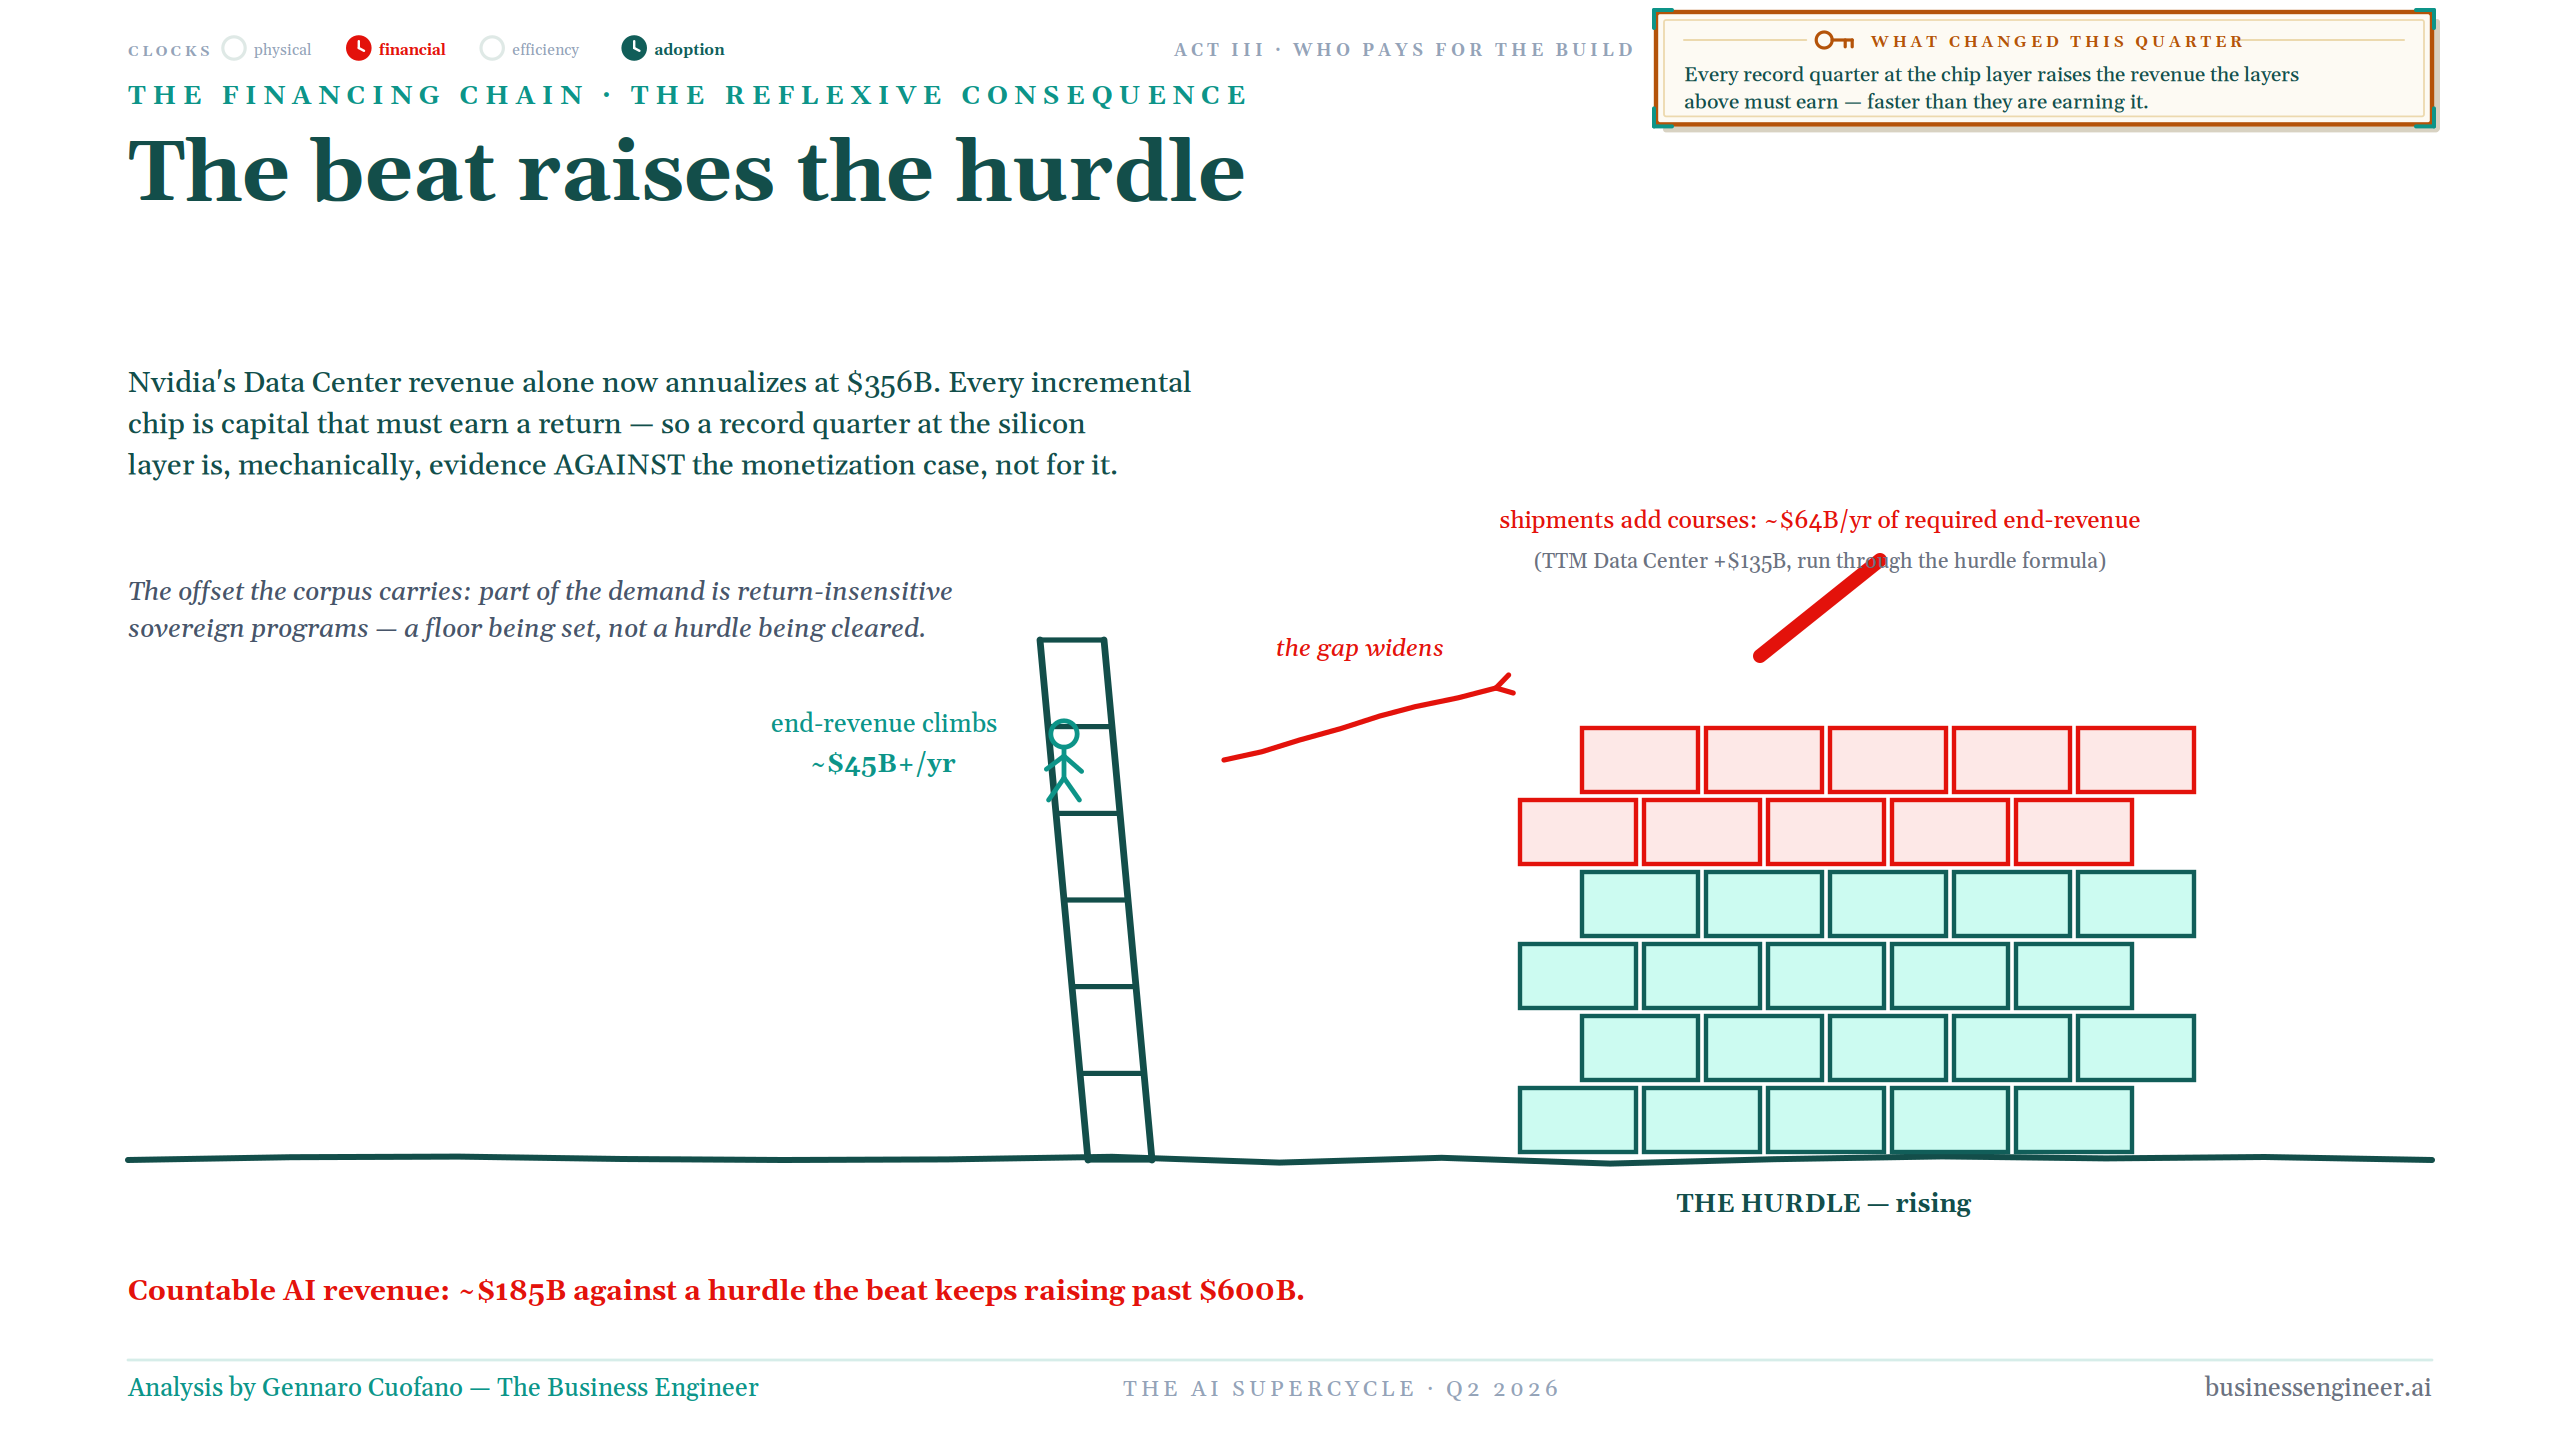
There is a reflexive consequence to all of this. Every spectacular NVIDIA quarter is evidence for the infrastructure-demand thesis. But every additional chip shipment is also capital that someone farther up the stack has to earn a return on.
NVIDIA’s data-center revenue alone now annualizes above roughly $356 billion. Run the incremental shipments through the return framework and they add something like $64 billion a year of required end-customer revenue. The application layer is adding closer to $45 billion a year.
So the gap can widen even during an extraordinary quarter.
This is the paradox at the center of the build: the better NVIDIA performs, the more the rest of the stack has to monetize.
Sovereign demand can soften this because part of the infrastructure is bought for strategic rather than purely financial reasons. But again, the state sets a floor. It does not clear the hurdle.
Countable AI revenue is currently around $185 billion. The hurdle is already above $600 billion. The beat raised it again.
THE CAPITAL MACHINE
Where the $602 billion comes from
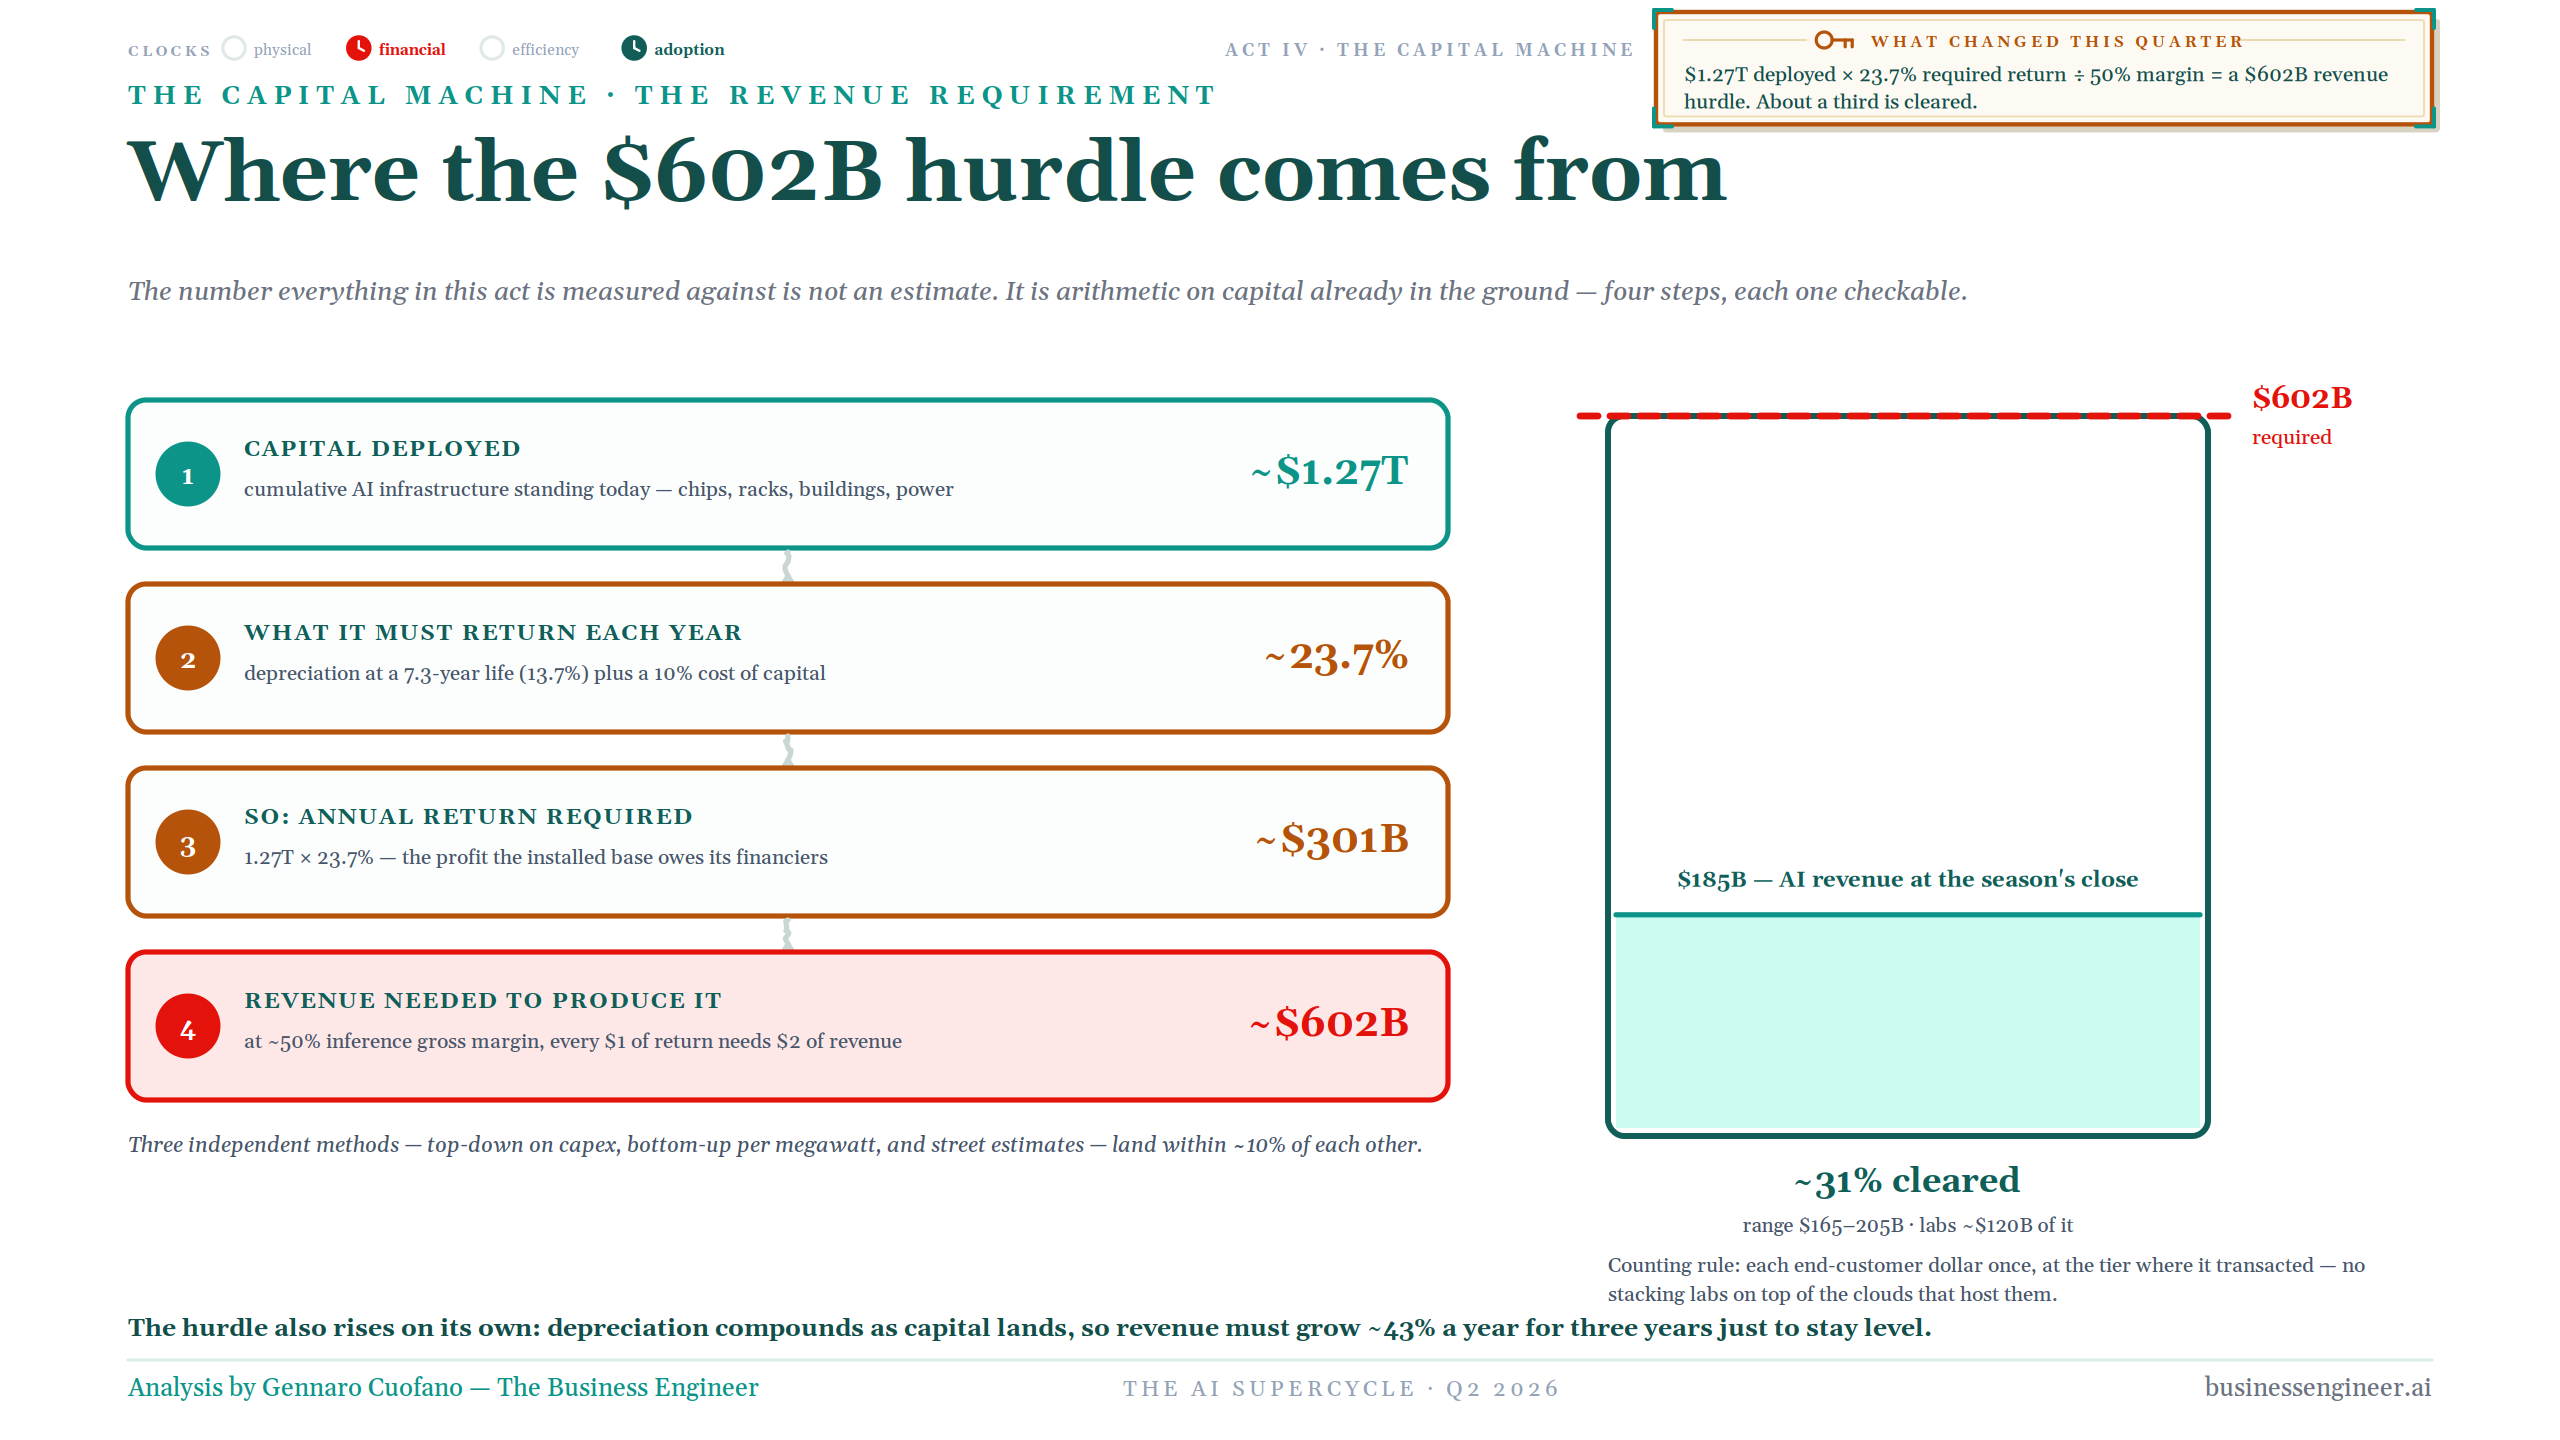
The $602 billion figure is not a forecast. It is a base-case estimate of the annual AI revenue required to economically support the infrastructure already deployed.
Start with roughly $1.27 trillion of deployed AI infrastructure across chips, racks, data centers and power. That capital has to do two things every year: absorb the economic depreciation of the assets and earn a return for the capital that funded them.
Using a 7.3-year blended economic life implies roughly 13.7% annual capital consumption. Add a 10% required return on invested capital, and the infrastructure carries an annual capital charge of about 23.7%.
On $1.27 trillion, that is roughly $301 billion per year.
The next step is to translate that capital charge into revenue. If roughly 50% of end-customer AI revenue is ultimately available to cover depreciation and the required return on capital, then the system needs approximately twice the capital charge in revenue:
$301B annual capital charge → roughly $602B of annual revenue.
Today, the map identifies around $185 billion of end-customer AI revenue, with a reasonable range of roughly $165–205 billion. On the base case, current monetization therefore represents about 31% of the $602 billion hurdle.
The key point is not that AI lacks revenue. It clearly does. The point is that the infrastructure has been built ahead of the monetization required to support it economically.
And the hurdle is still moving. More accelerators are being installed, more data centers are being built and more power is being contracted. Every additional dollar of deployed capital increases the amount of revenue the system will eventually need to support.
So the question is straightforward:
Can AI monetization grow fast enough to catch a capital base that is still expanding?

*Base-case assumptions: $1.27T deployed capital; 7.3-year blended economic life; 10% required return; 50% contribution margin available to service the capital base. The $602B figure is a scenario hurdle, not a revenue forecast. The two anchor inputs also matter. The $1.27 trillion deployed-capital estimate and the $185 billion end-customer revenue estimate should be read as model inputs built from the underlying company and infrastructure data, not as reported industry accounting figures. The methodology and accompanying model are therefore designed so those inputs can be challenged separately from the arithmetic built on top of them.
Revenue per megawatt
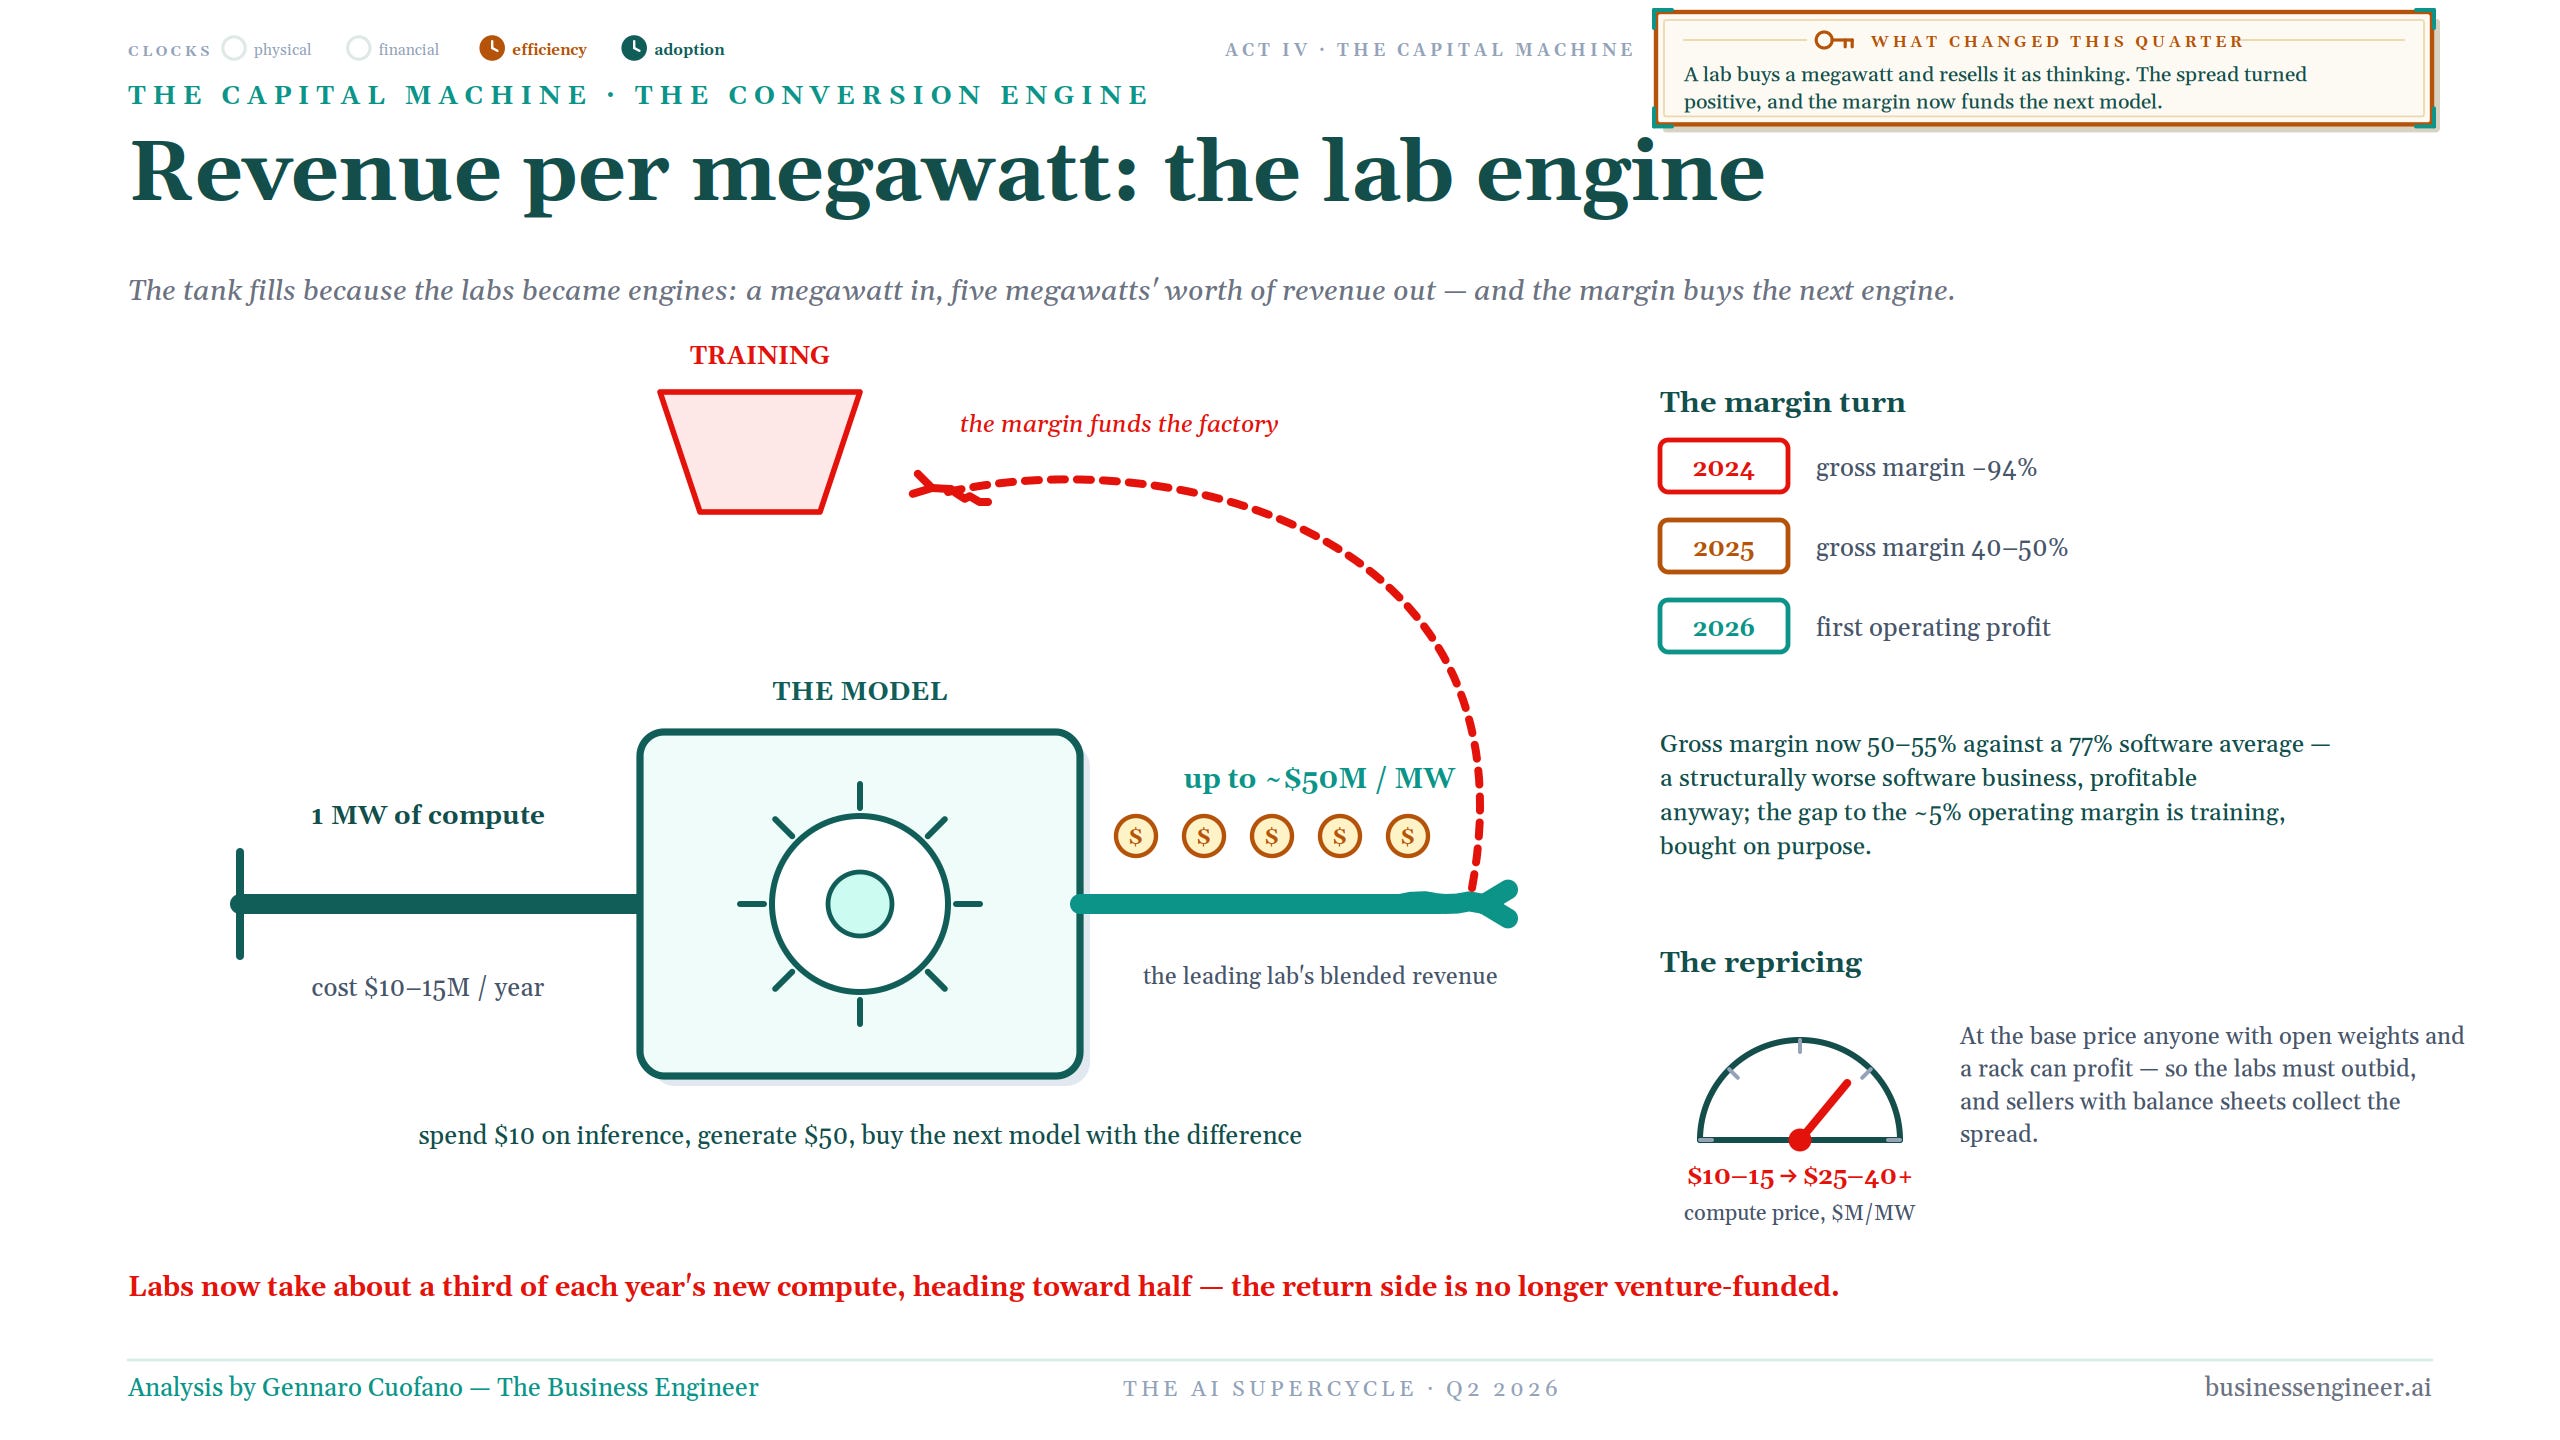
The most intuitive way to understand that conversion is through a megawatt. A megawatt of compute can cost roughly $10–15 million a year. The leading labs can now generate blended revenue approaching $50 million per megawatt.
That is the engine. Buy one megawatt. Turn it into intelligence. Sell the intelligence at a multiple of the underlying compute cost. Use the margin to finance the next model.
This is where the labs begin looking less like venture-funded research institutions and more like actual economic engines.
The gross-margin path has been violent. Economics that looked completely unsustainable two years ago have moved toward 50–55% gross margins, and the strongest labs have begun showing positive operating economics.
That is still structurally worse than conventional software, where gross margin can sit around 77%. But it can be profitable. And a large part of the gap between gross margin and operating margin is deliberate spending on the next training cycle.
In other words, the model funds the factory that builds its successor.
There is also a deeper strategic consequence of open weights. Once open models and self-hosted infrastructure can earn a return at the base price of compute, frontier labs have to outbid an increasingly credible alternative for scarce megawatts. The efficiency race therefore becomes part of the capital-allocation race.
Where it would actually break
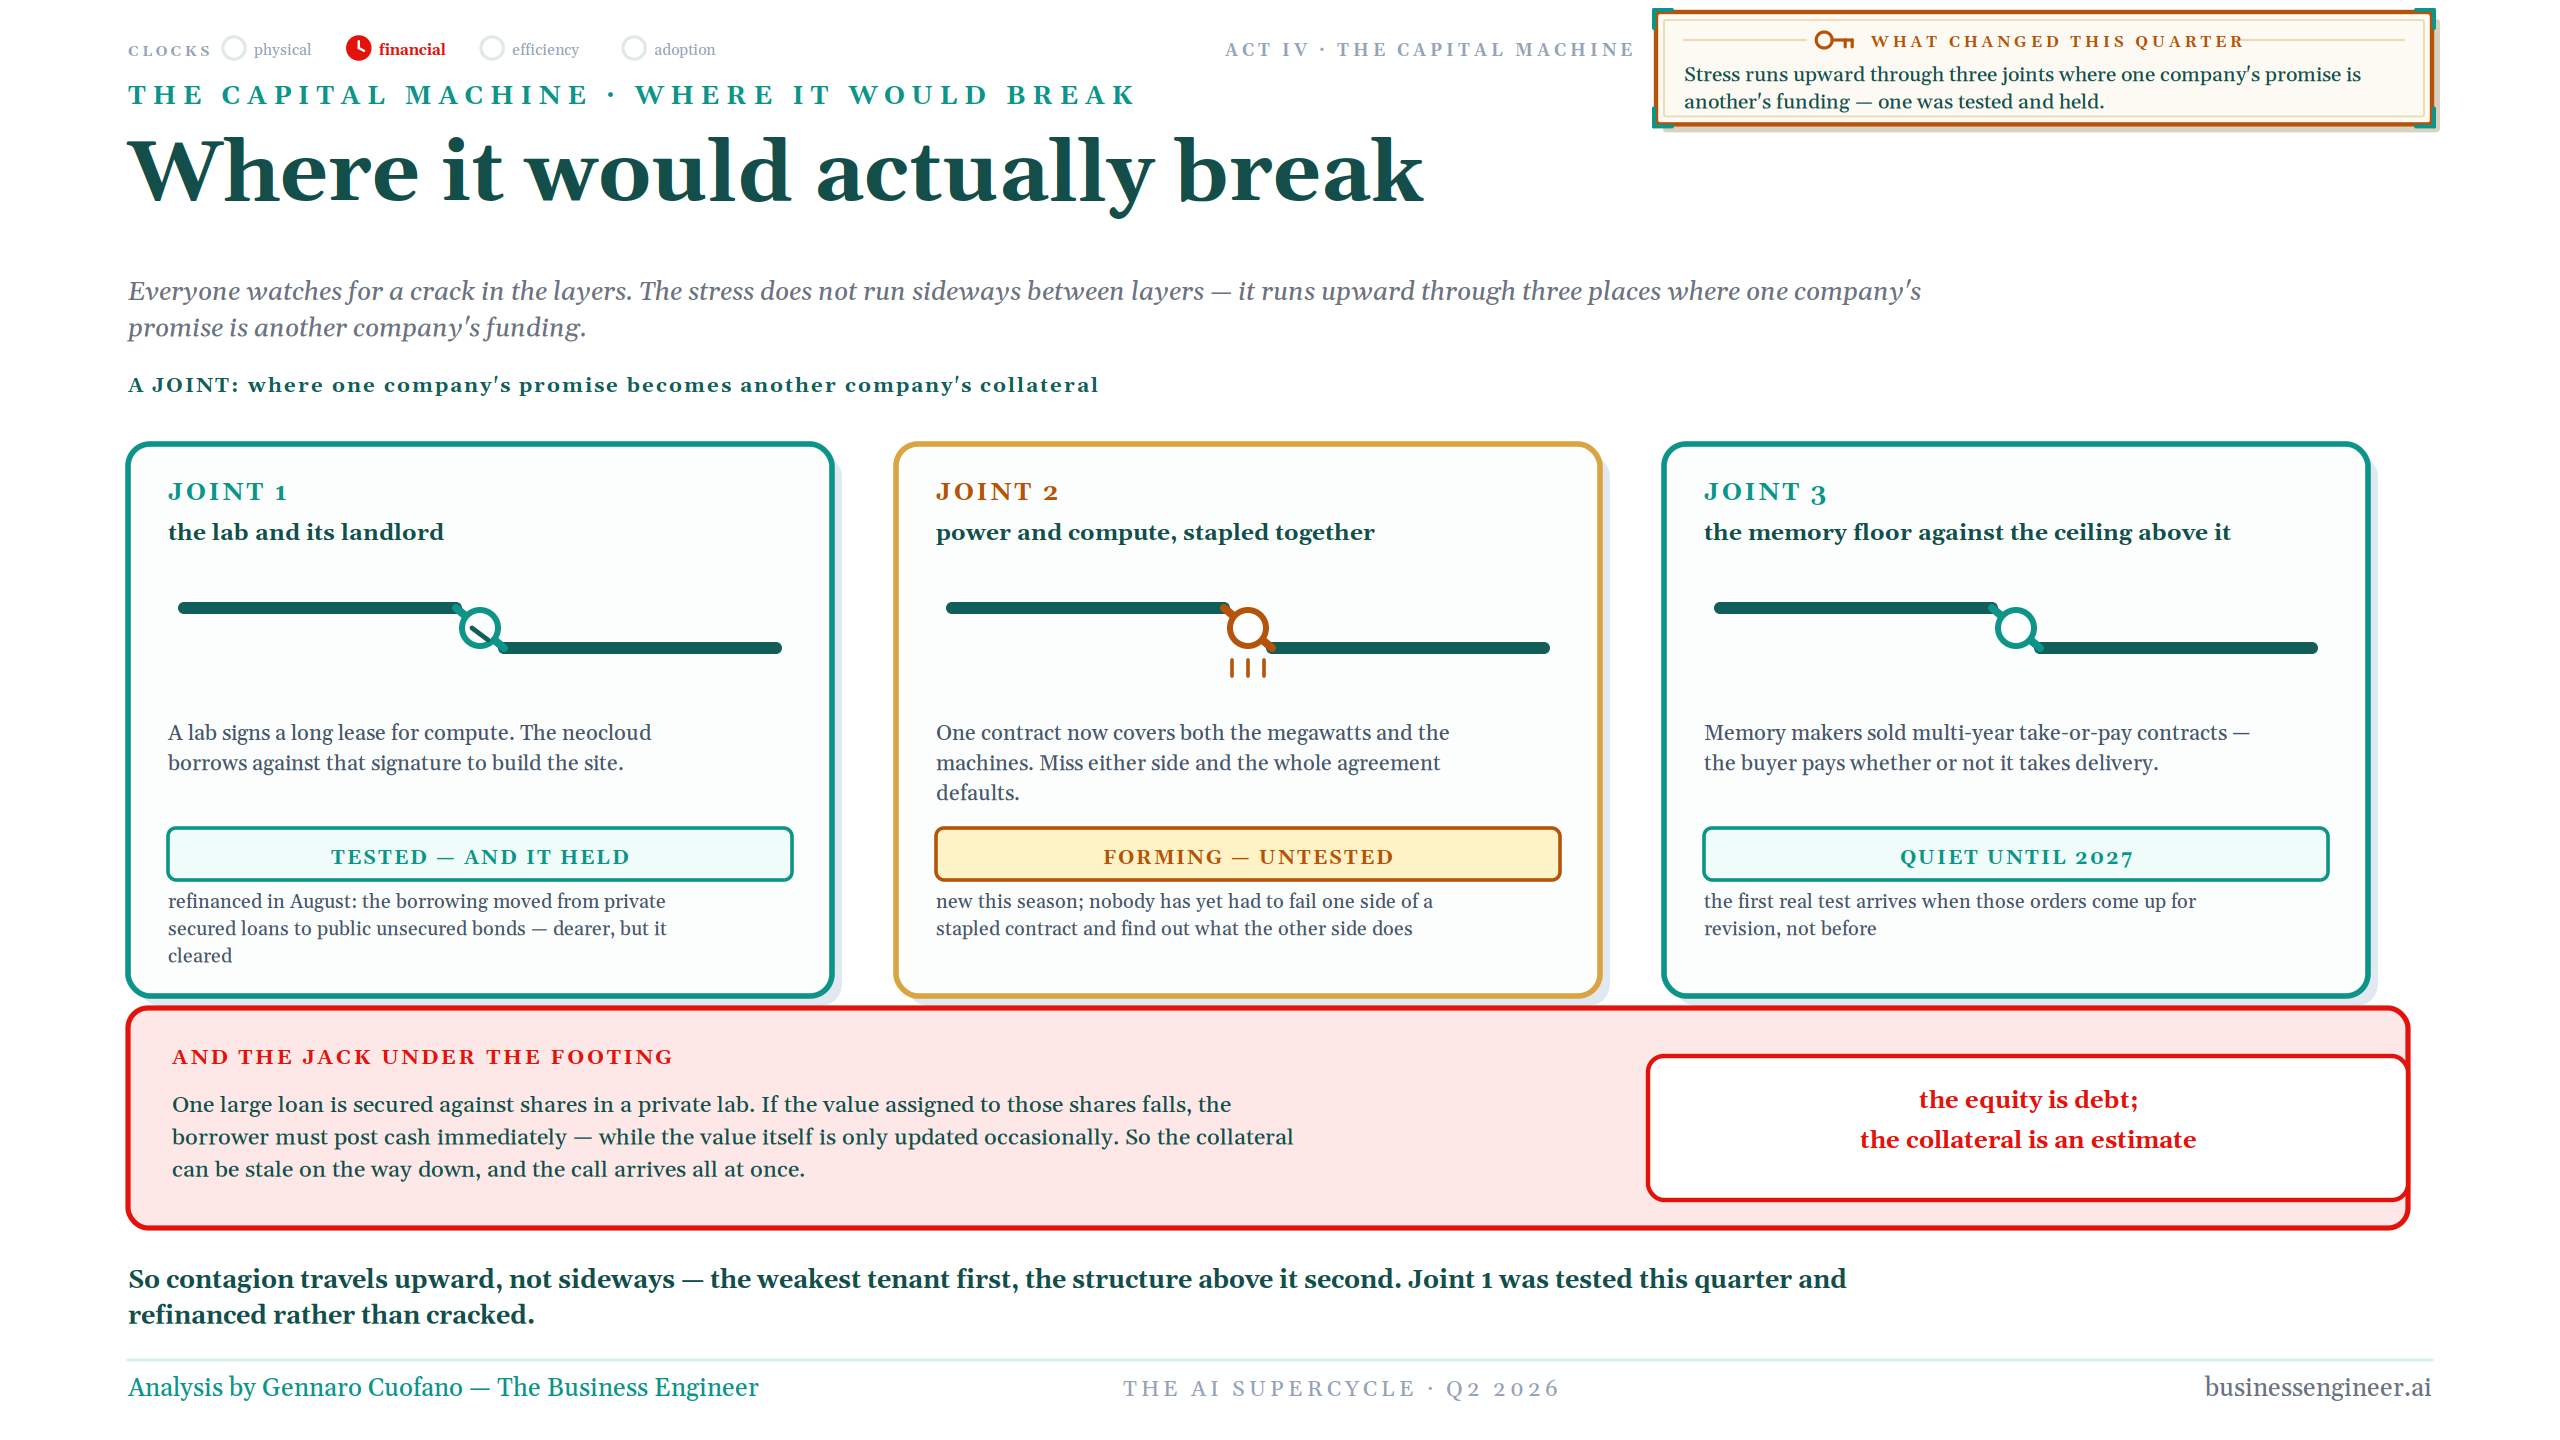
Everyone looks for the failure in the layers. The more interesting failure points sit in the joints.
A joint is where one company’s promise becomes another company’s collateral.
The first joint connects the lab and its landlord. A lab signs a long-duration compute commitment. The neocloud borrows against that signature to build the site. That joint has already been tested. It refinanced. Private secured borrowing migrated into public unsecured debt. The financing became more expensive, but the joint held.
The second joint connects power and compute. Increasingly, the megawatts and the machines sit inside the same contractual structure or SPV. If one side fails, we still do not know exactly what the other side does. That joint is forming. It remains largely untested.
The third joint connects the memory floor with the financial ceiling above it. Memory producers have protected themselves with multi-year take-or-pay commitments, while the companies farther up the stack remain dependent on monetization and credit. Those curves can diverge for a while. The real test may not arrive until 2027, when the long-dated orders eventually have to be revised.
Then there is a jack underneath the entire footing: debt secured against shares in private AI companies. If the mark on that collateral falls, the borrower can be required to post real cash against a value that itself is only periodically updated.
That produces one of the most uncomfortable sentences in the deck: the equity is debt; the collateral is an estimate.
This is why contagion does not necessarily run sideways through adjacent technological layers. It can run upward through the financial joints. The weakest tenant first. The structure financed against the tenant second. The layer above it next.
The bright streetlight
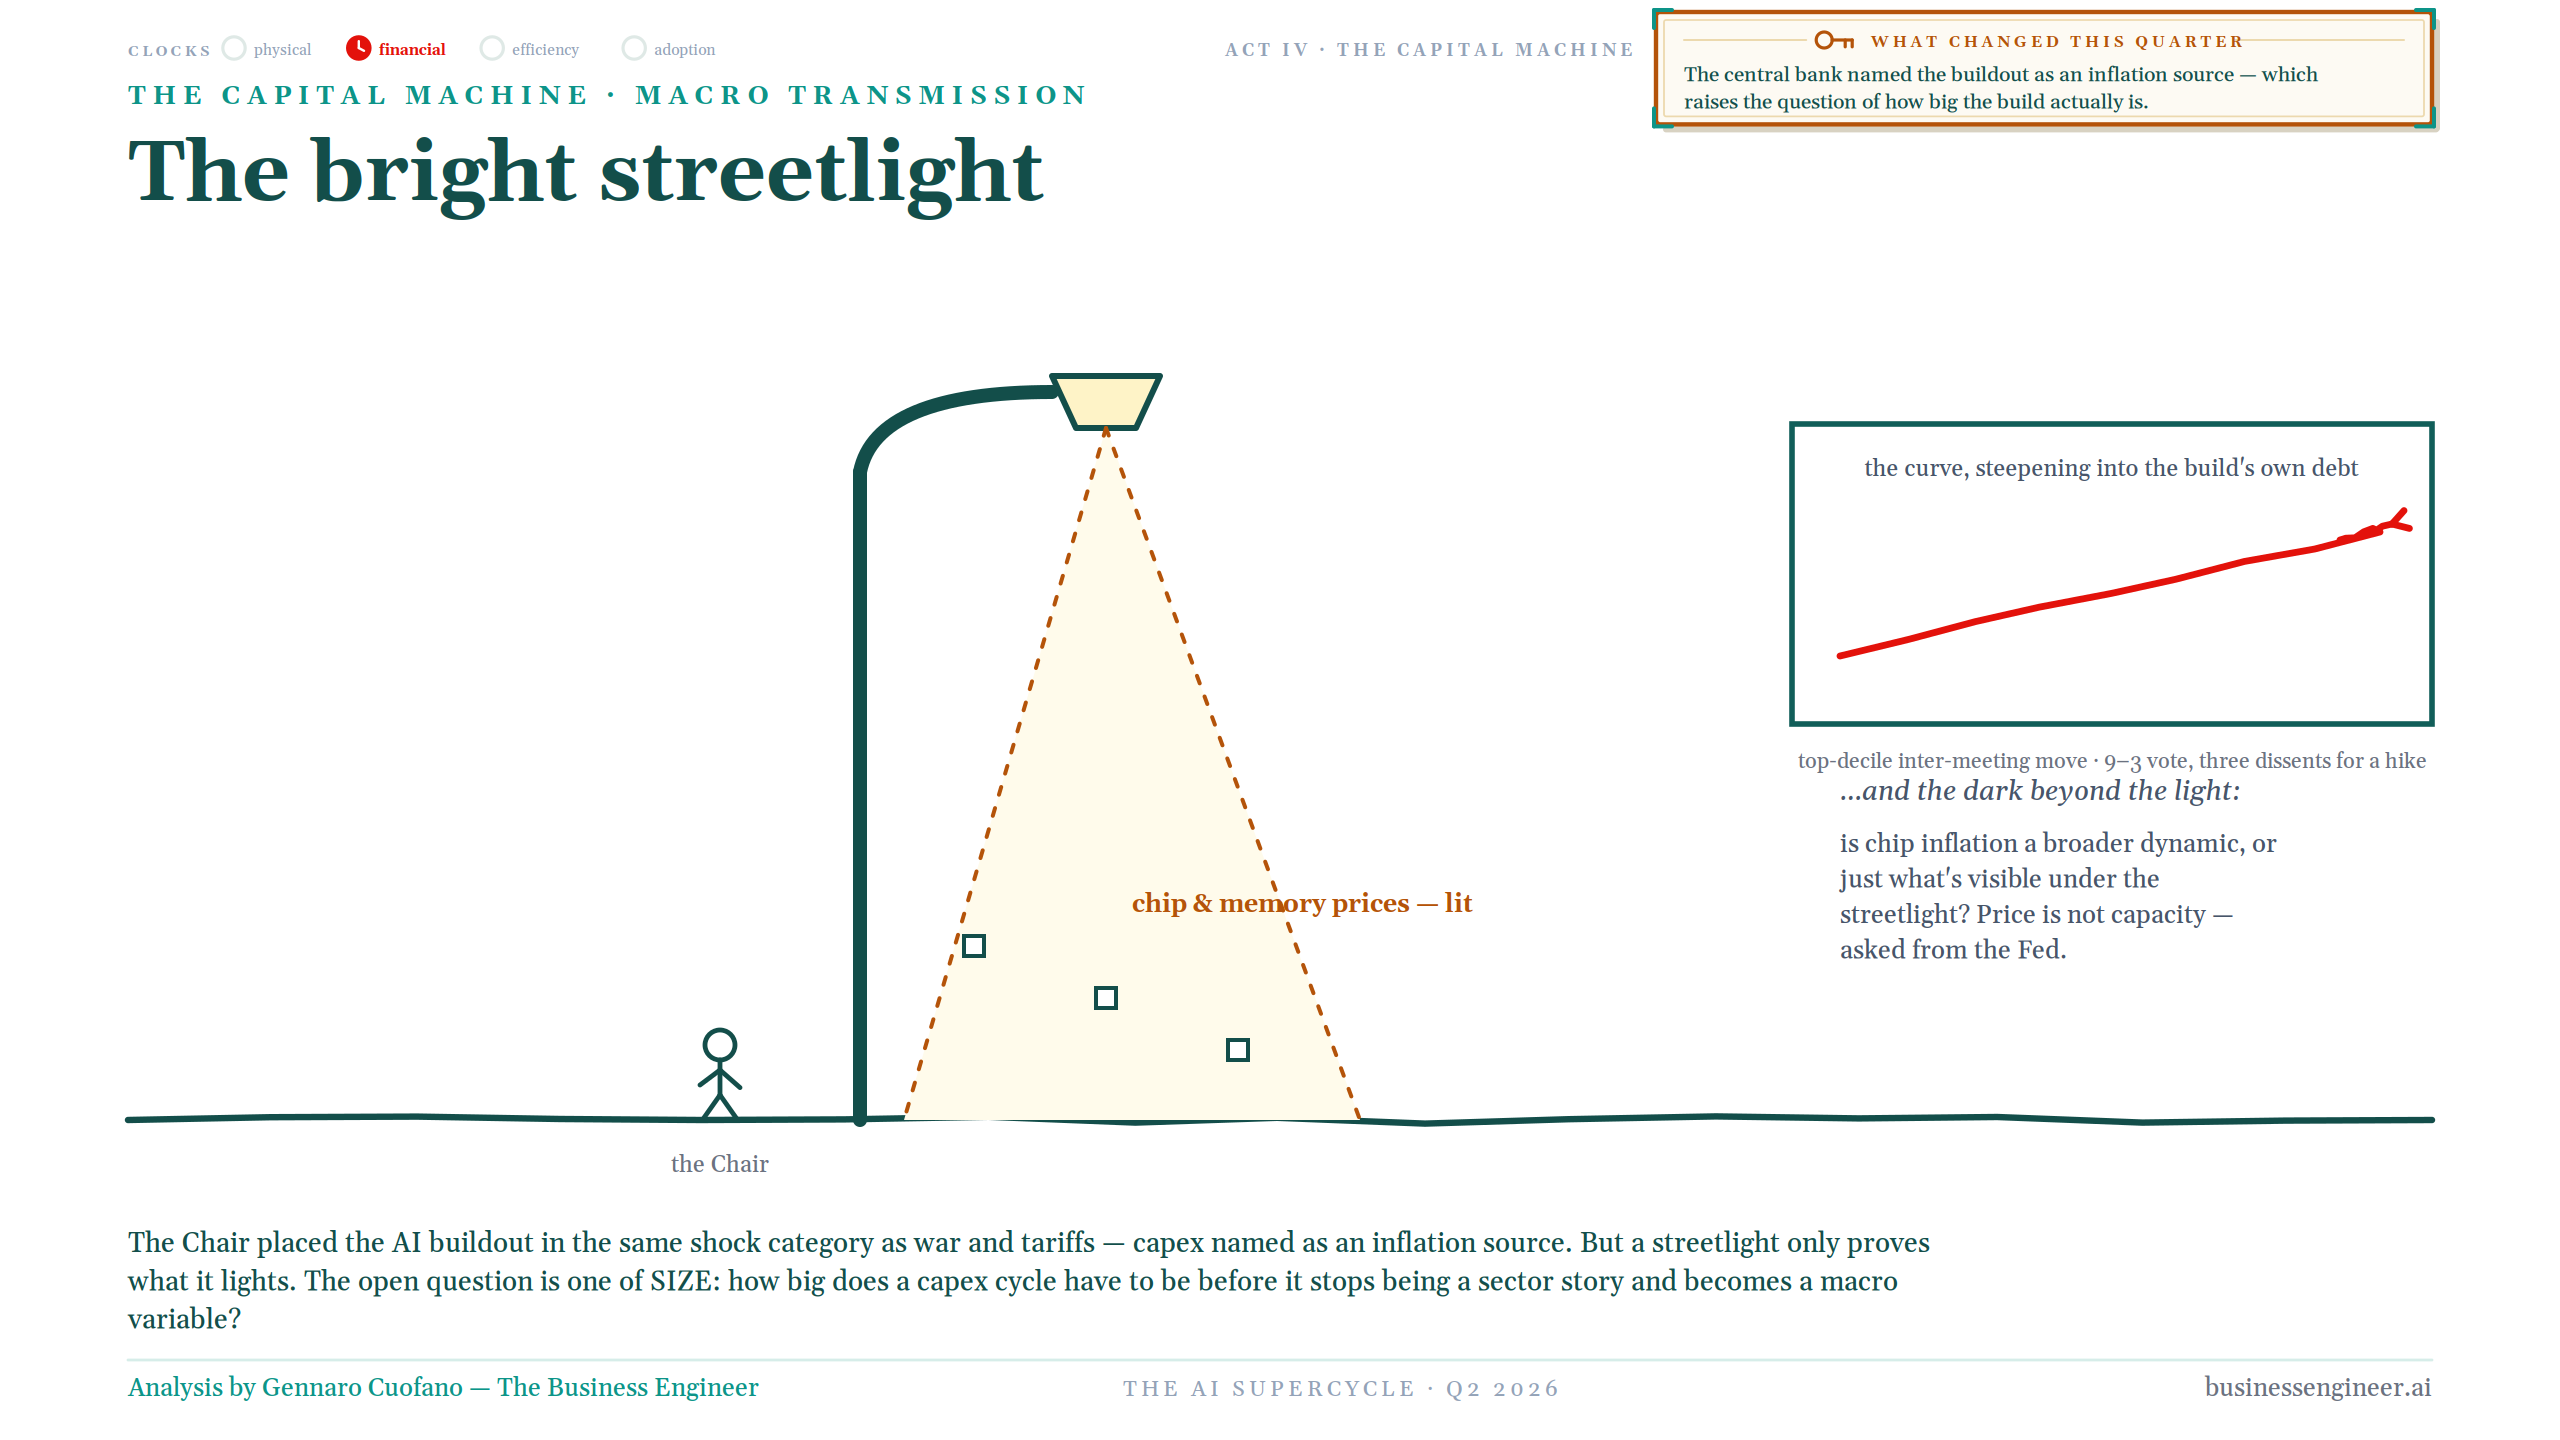
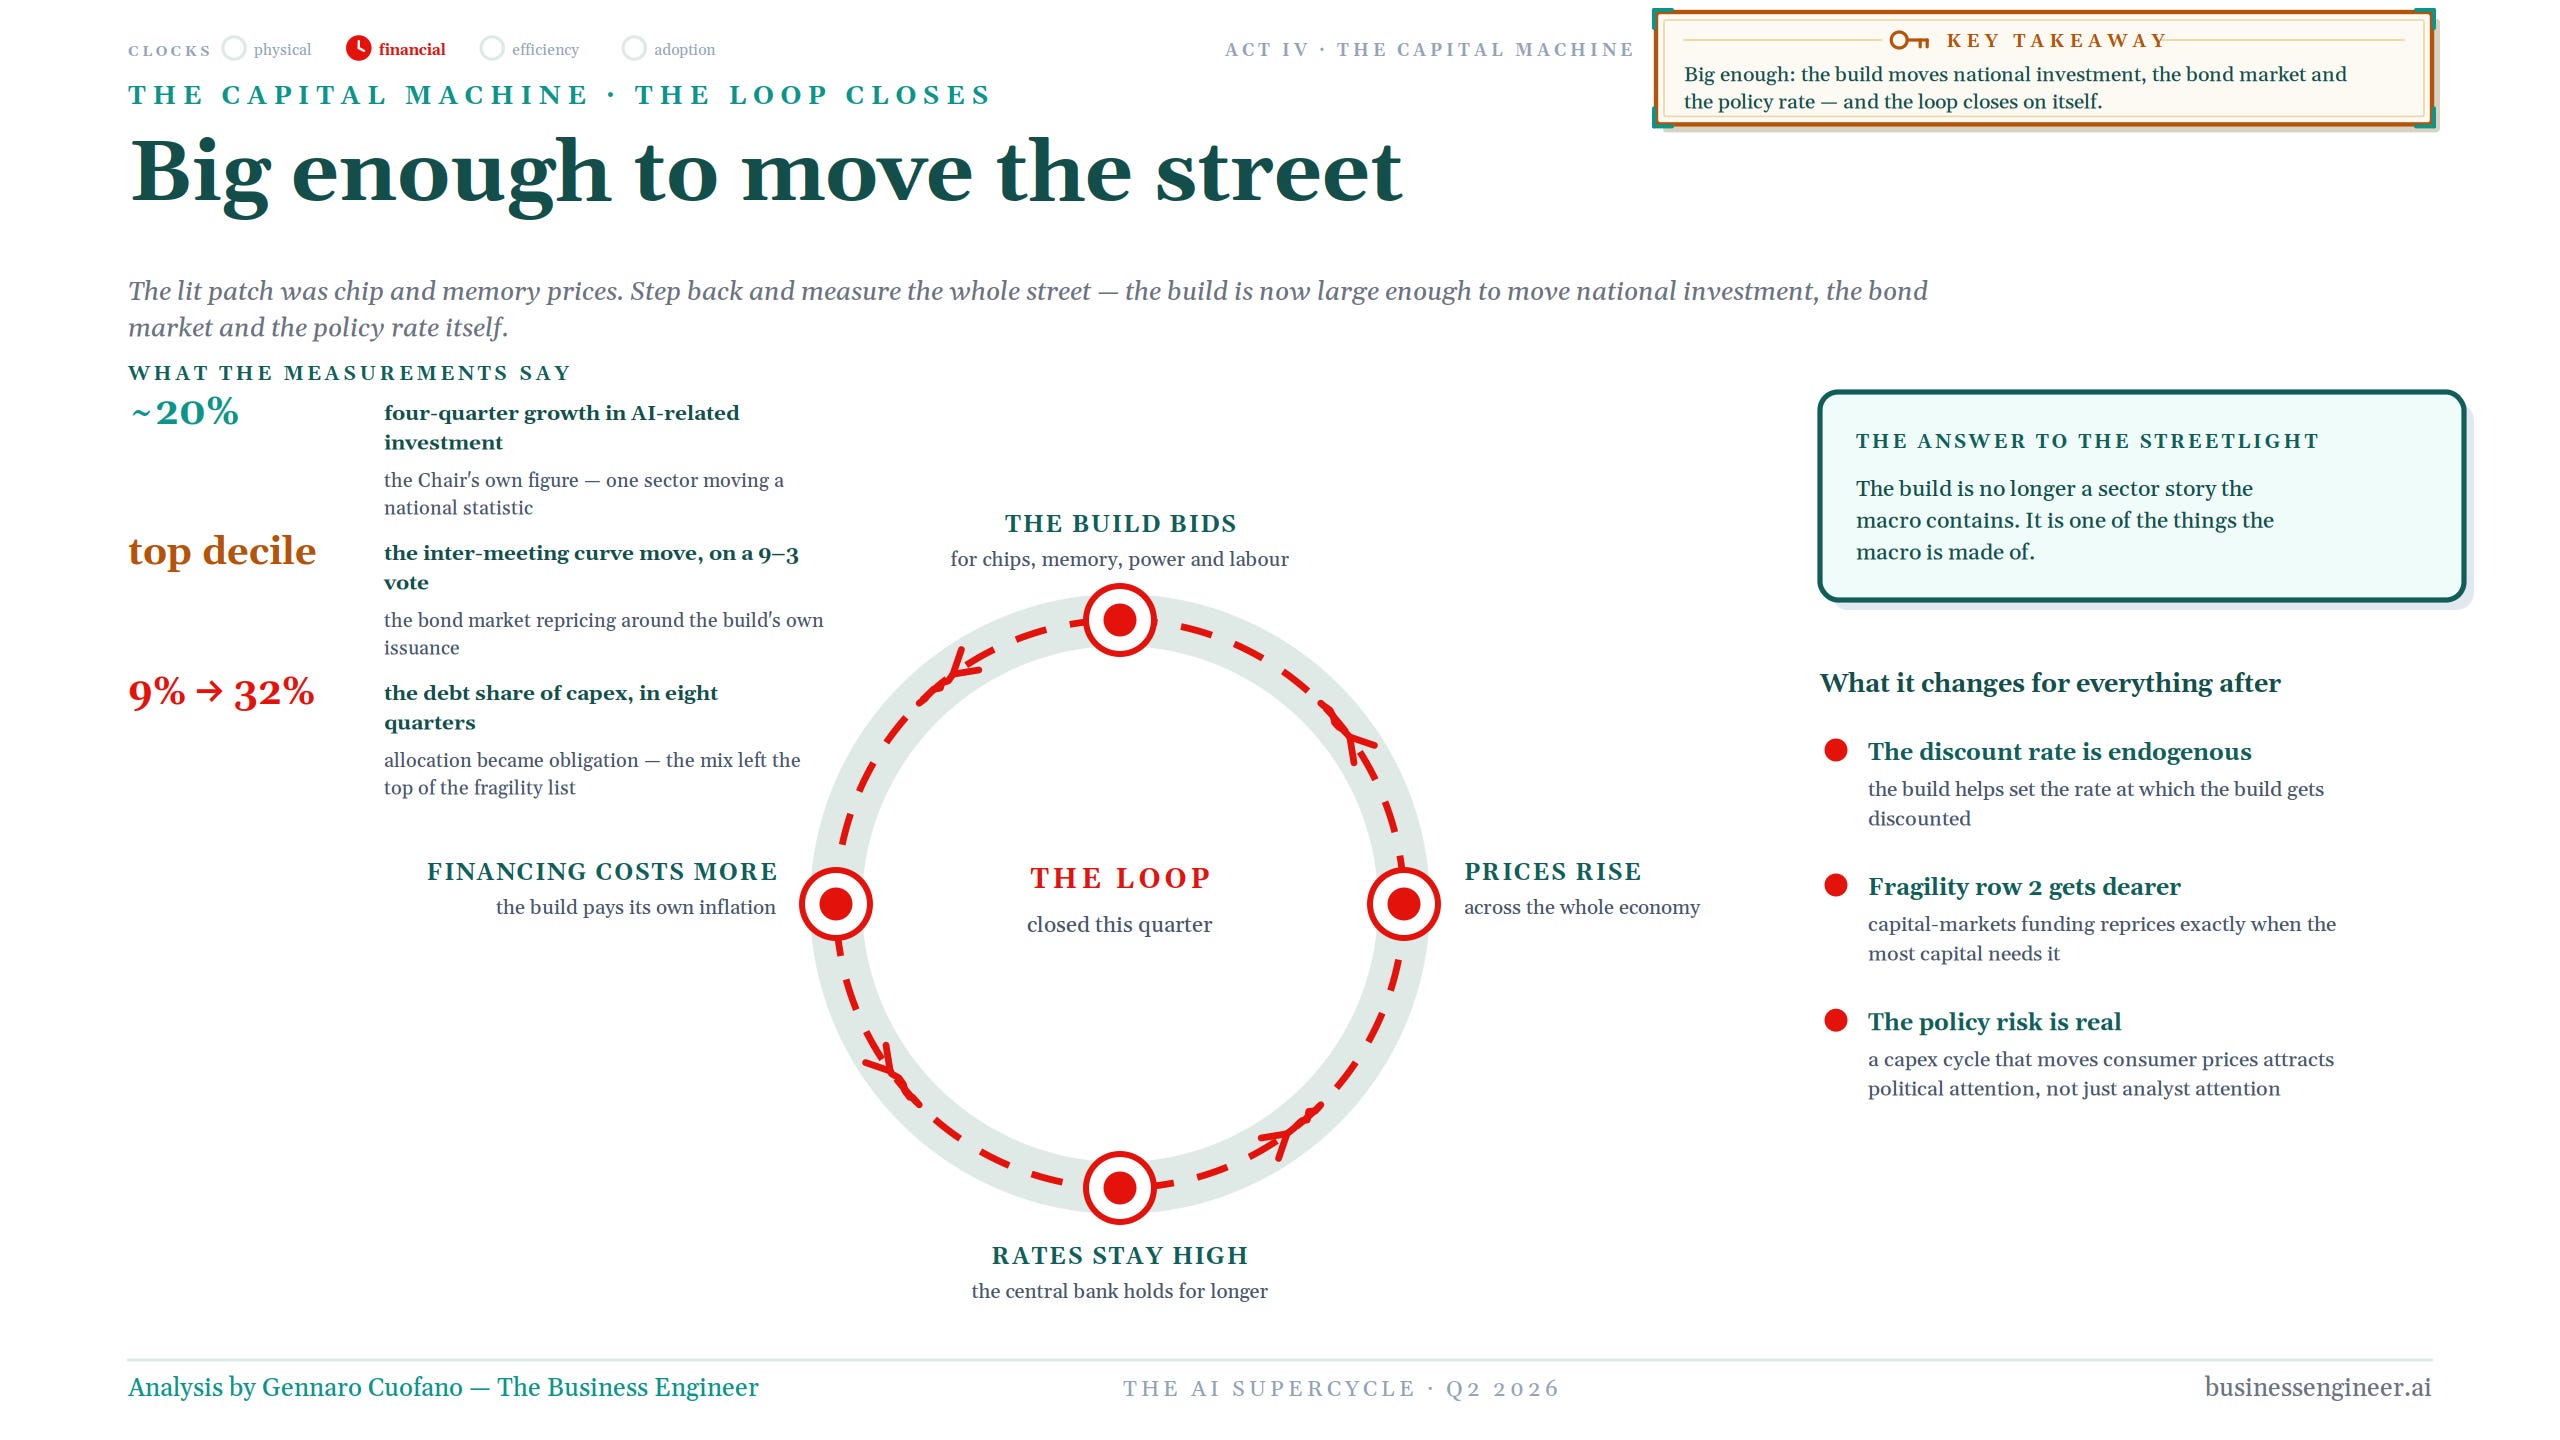
This quarter, the build also crossed another boundary. The central bank began speaking about AI capex as an inflation source in the same macro conversation as war and tariffs.
That is important. But a streetlight only tells you what it illuminates. Chip and memory inflation are visible. The harder question is whether they are merely the lit patch or evidence of a much larger economic effect.
The answer increasingly looks like the latter.
AI-related investment is growing at roughly 20% over four quarters in the framework. The bond market has already been repricing around the build’s issuance. The debt share of capex has moved from approximately 9% to 32% in eight quarters.
The build has become big enough to affect national investment, the bond market and eventually the policy rate itself.
That closes a loop. The build bids for chips, memory, power, transformers, labor and land. Prices rise across the broader economy. Rates stay higher because inflation remains harder to suppress. Financing costs rise for the same AI infrastructure absorbing the capital.
The build therefore begins paying its own inflation.
That changes several things at once. The discount rate is no longer an entirely external variable. The build itself helps influence the rate at which the build gets discounted. Capital-market funding becomes more expensive exactly when the infrastructure requires more of it. And a capex cycle that moves consumer prices begins attracting political attention, not merely analyst attention.
At that point AI is no longer simply happening inside the macroeconomy. The macroeconomy begins responding to AI.
THE MODEL LAYER
Anatomy is economics
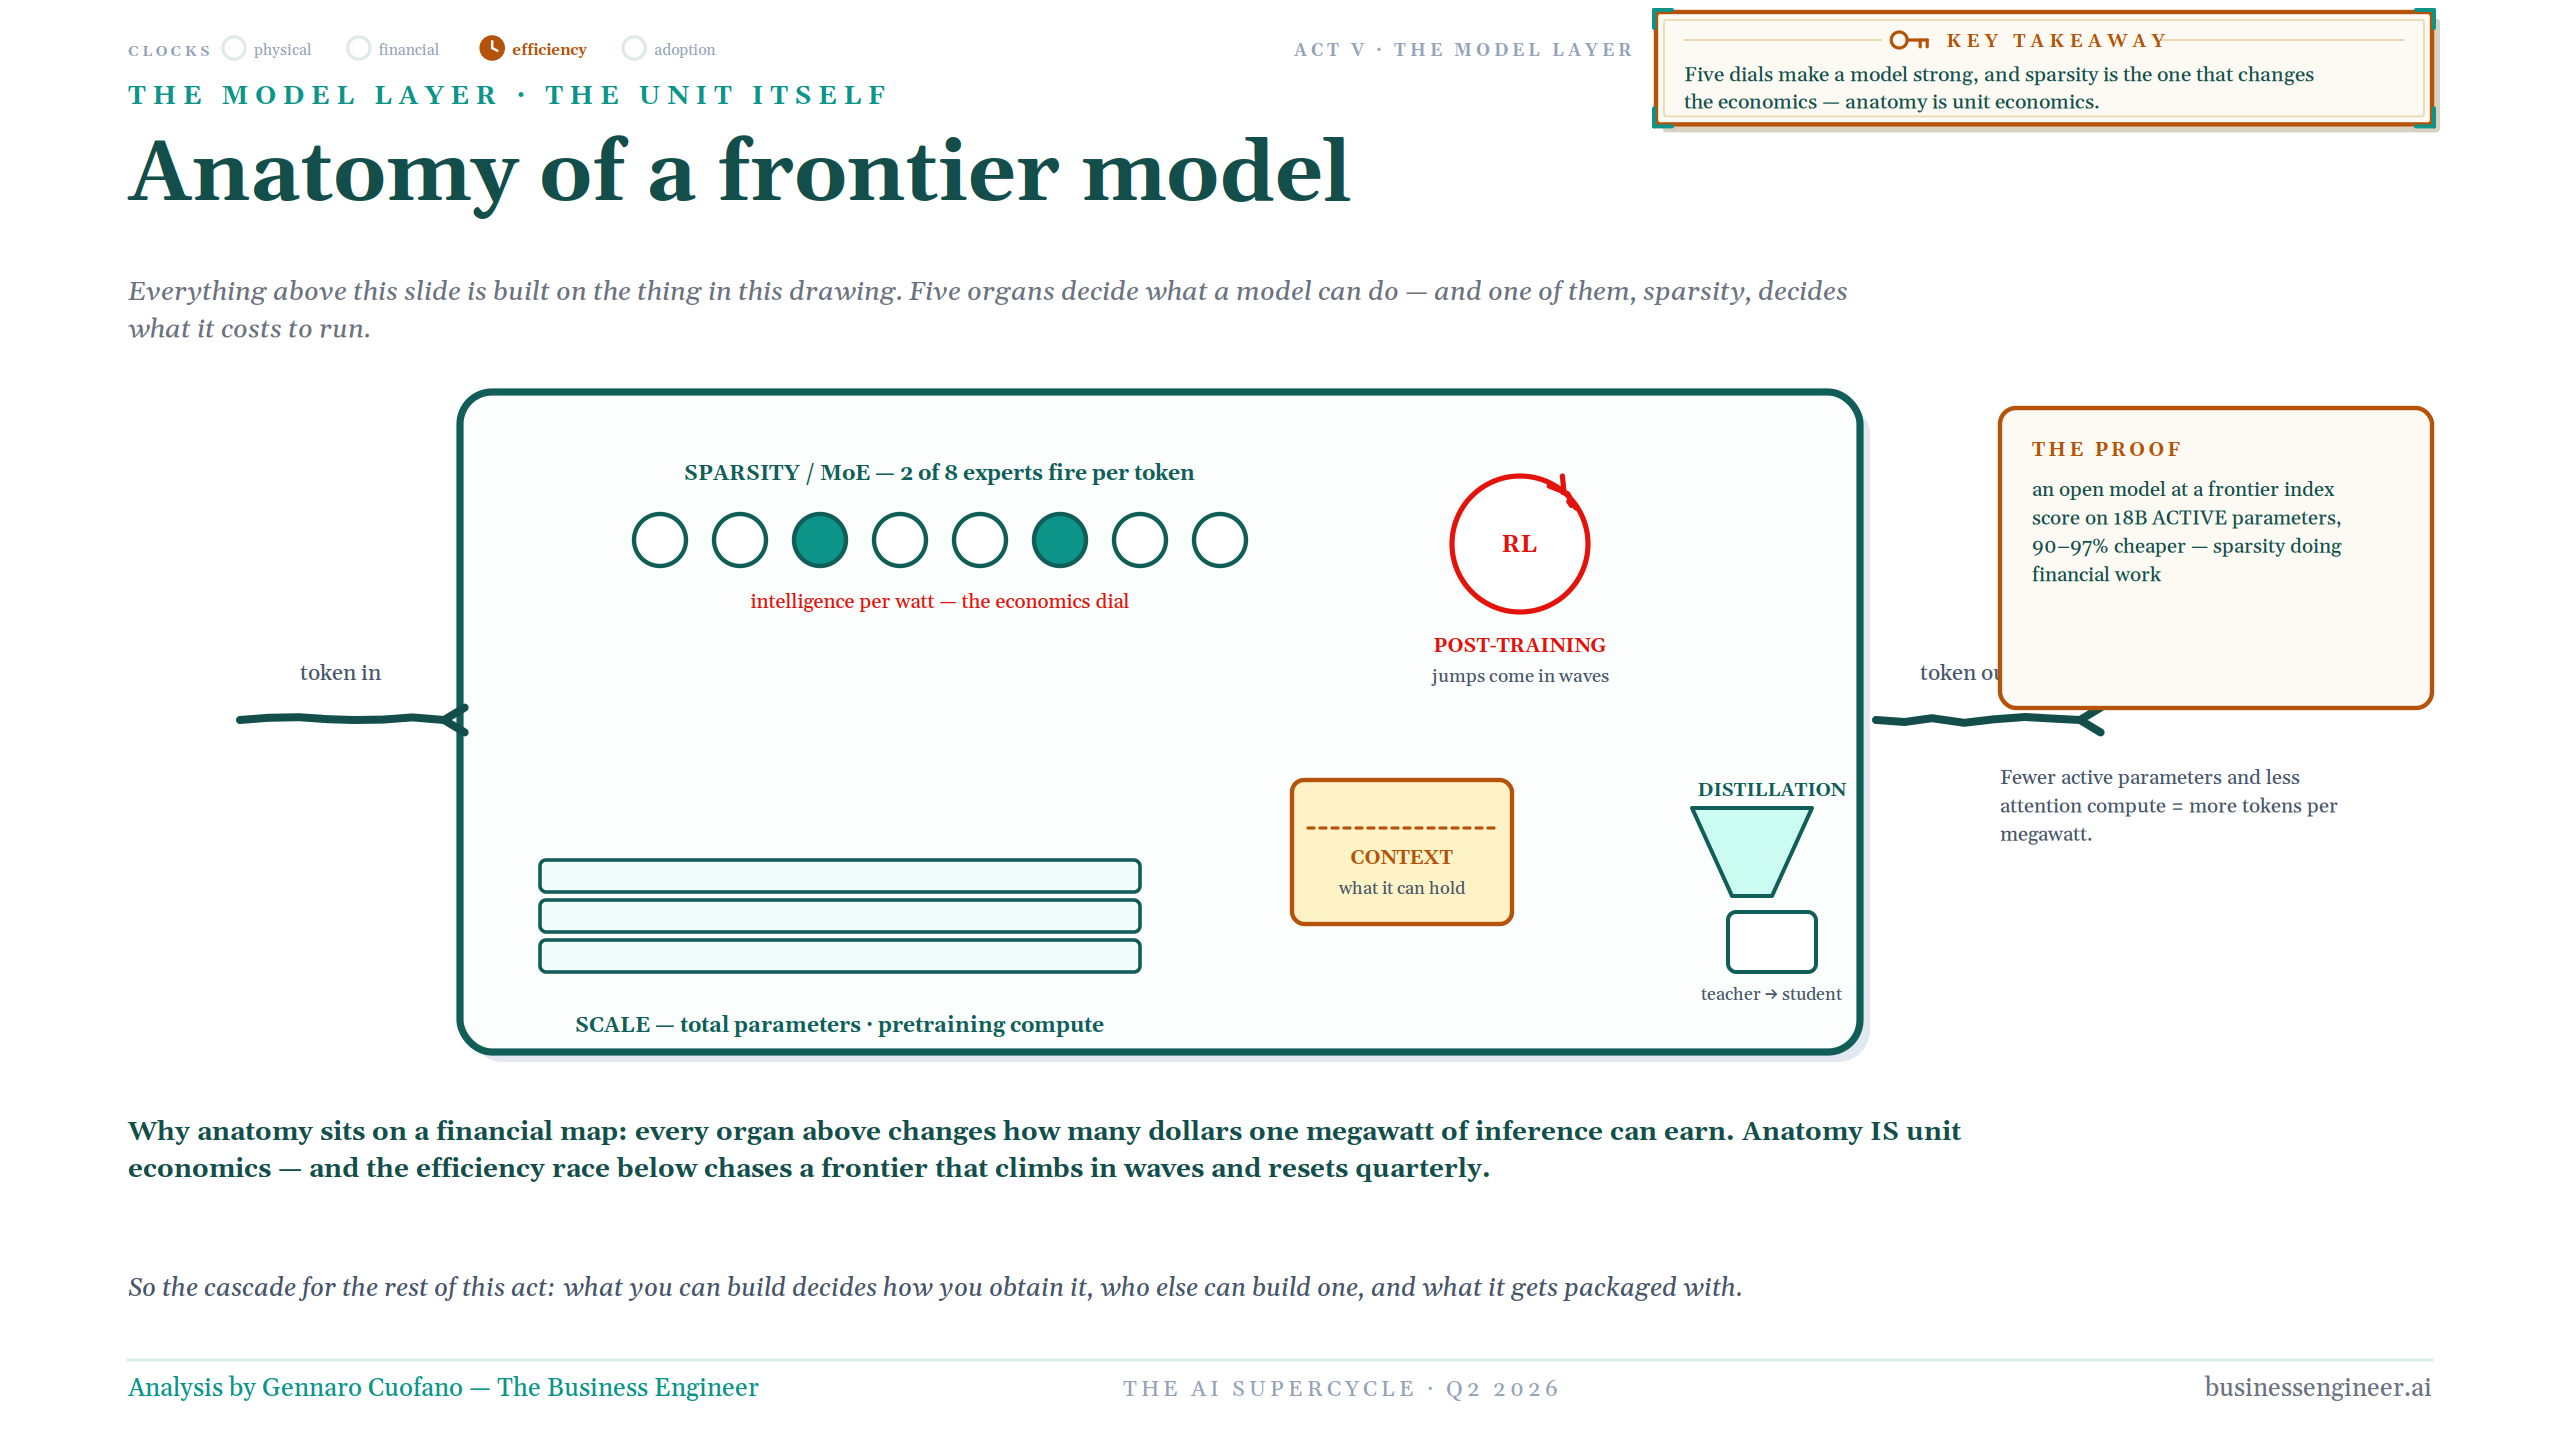
We can finally move above the physical and financial plant and into the model itself. A frontier model is not one dial. It is a combination of scale, sparsity, post-training, context and distillation.
Scale determines the total parameter base and pretraining investment. Sparsity determines how much of that model actually activates for each token. Post-training and reinforcement learning can move capability in discontinuous jumps. Context determines what the model can hold. Distillation transfers capability downward into smaller systems.
What interests me is that every one of those technical choices is simultaneously an economic choice.
Sparsity is the cleanest example. If only two out of eight experts fire for a token, you can preserve an enormous parameter base while drastically reducing the compute activated for each unit of work.
That is intelligence per watt.
And that is why model anatomy belongs on a financial map.
Some open models can now produce scores approaching frontier systems on selected benchmarks while activating only a fraction of their total parameter base and delivering dramatically lower inference costs. The exact cost advantage depends on workload, hardware, serving architecture and benchmark, so the percentage should never be treated as universal.
But the direction is clear:
The technical architecture is doing financial work.
Three ways to get a model
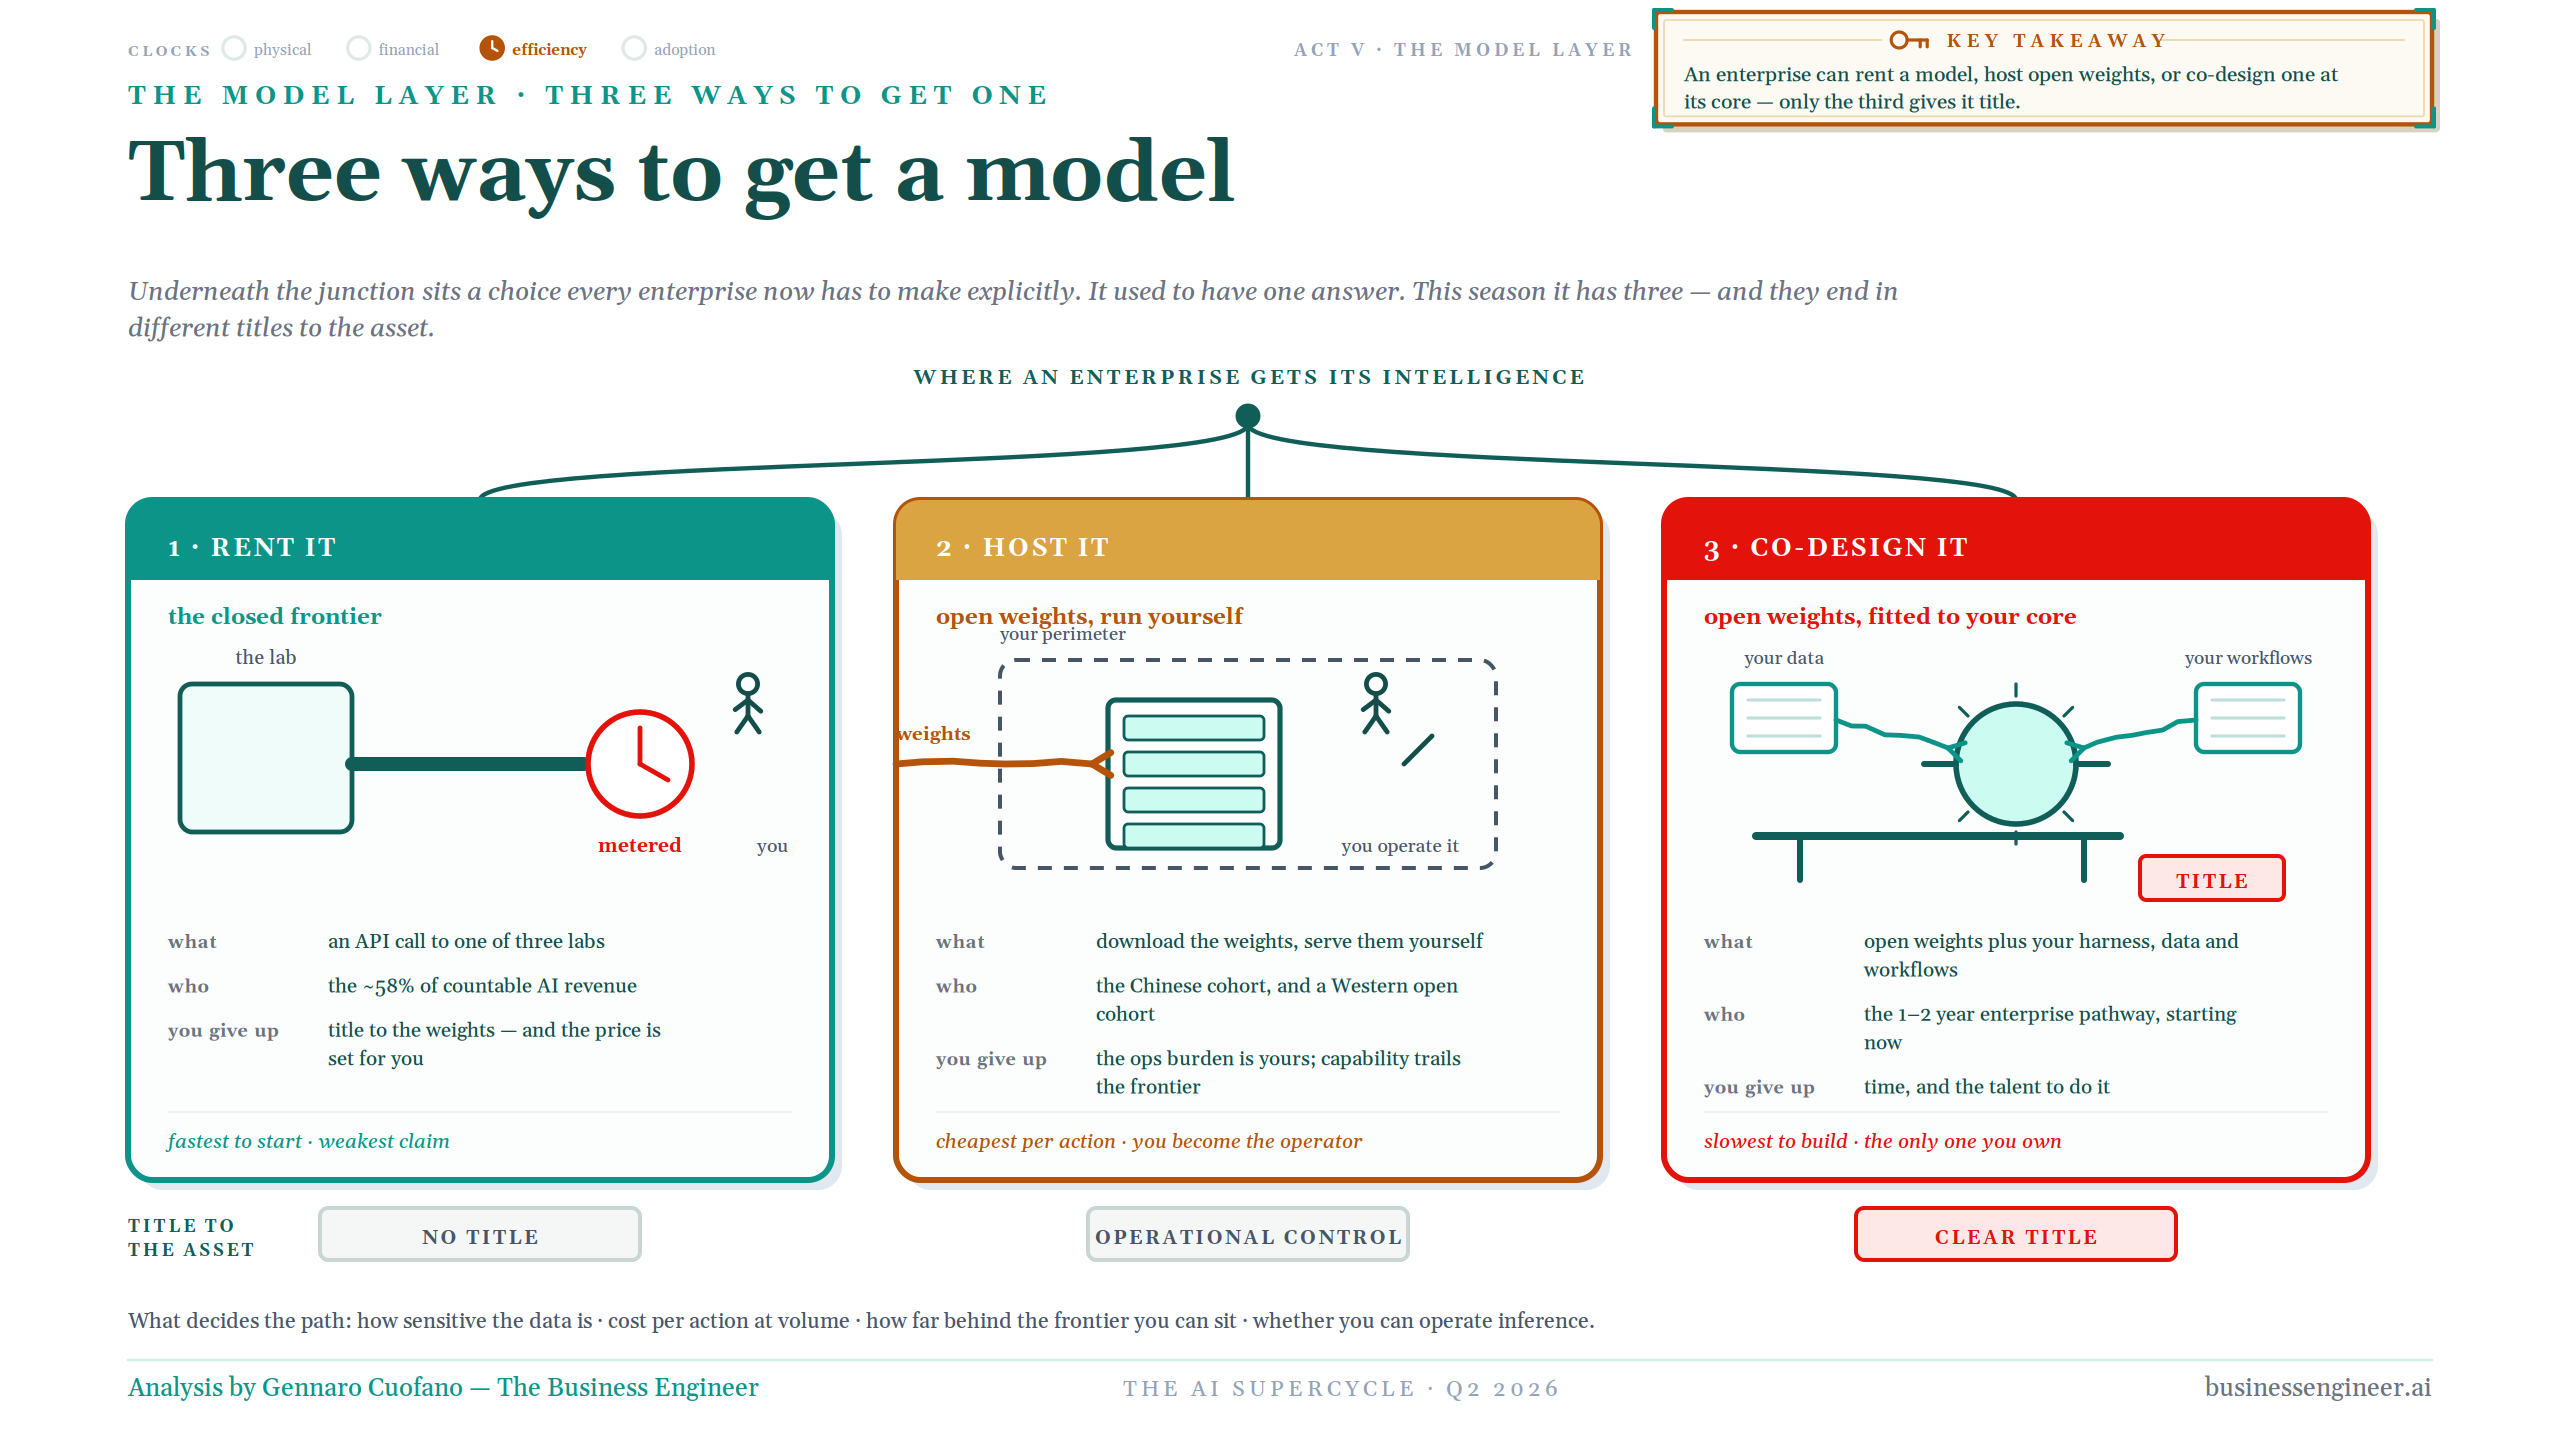
That changes the enterprise question. A year ago, “Which model should we use?” often sounded like one question. It is now at least three.
The first path is to rent it. Call a closed frontier model through an API. You get immediate access to the strongest capabilities. You avoid the infrastructure burden. The price is metered. But you do not own the asset. You have no title to the underlying weights, and the provider sets the price.
The second path is to host it. Take open weights and run them yourself. You gain operational control and potentially much lower cost per action. But the infrastructure and inference burden becomes yours, and capability may still lag the absolute frontier. You have operational control. You still do not have complete title to the intelligence architecture.
Then comes the third path: co-design it. Take open weights and fit them around your own harness, data, workflows and operating core. This is slower. It requires time and talent. It may take one or two years to become truly enterprise-native. But it is the only path that ends with something closer to clear title.
That changes the enterprise decision from Which model should I buy? to Which intelligence should I own at the core?
That may become one of the most important enterprise questions of the next few years.
The challengers: the gate and the tide
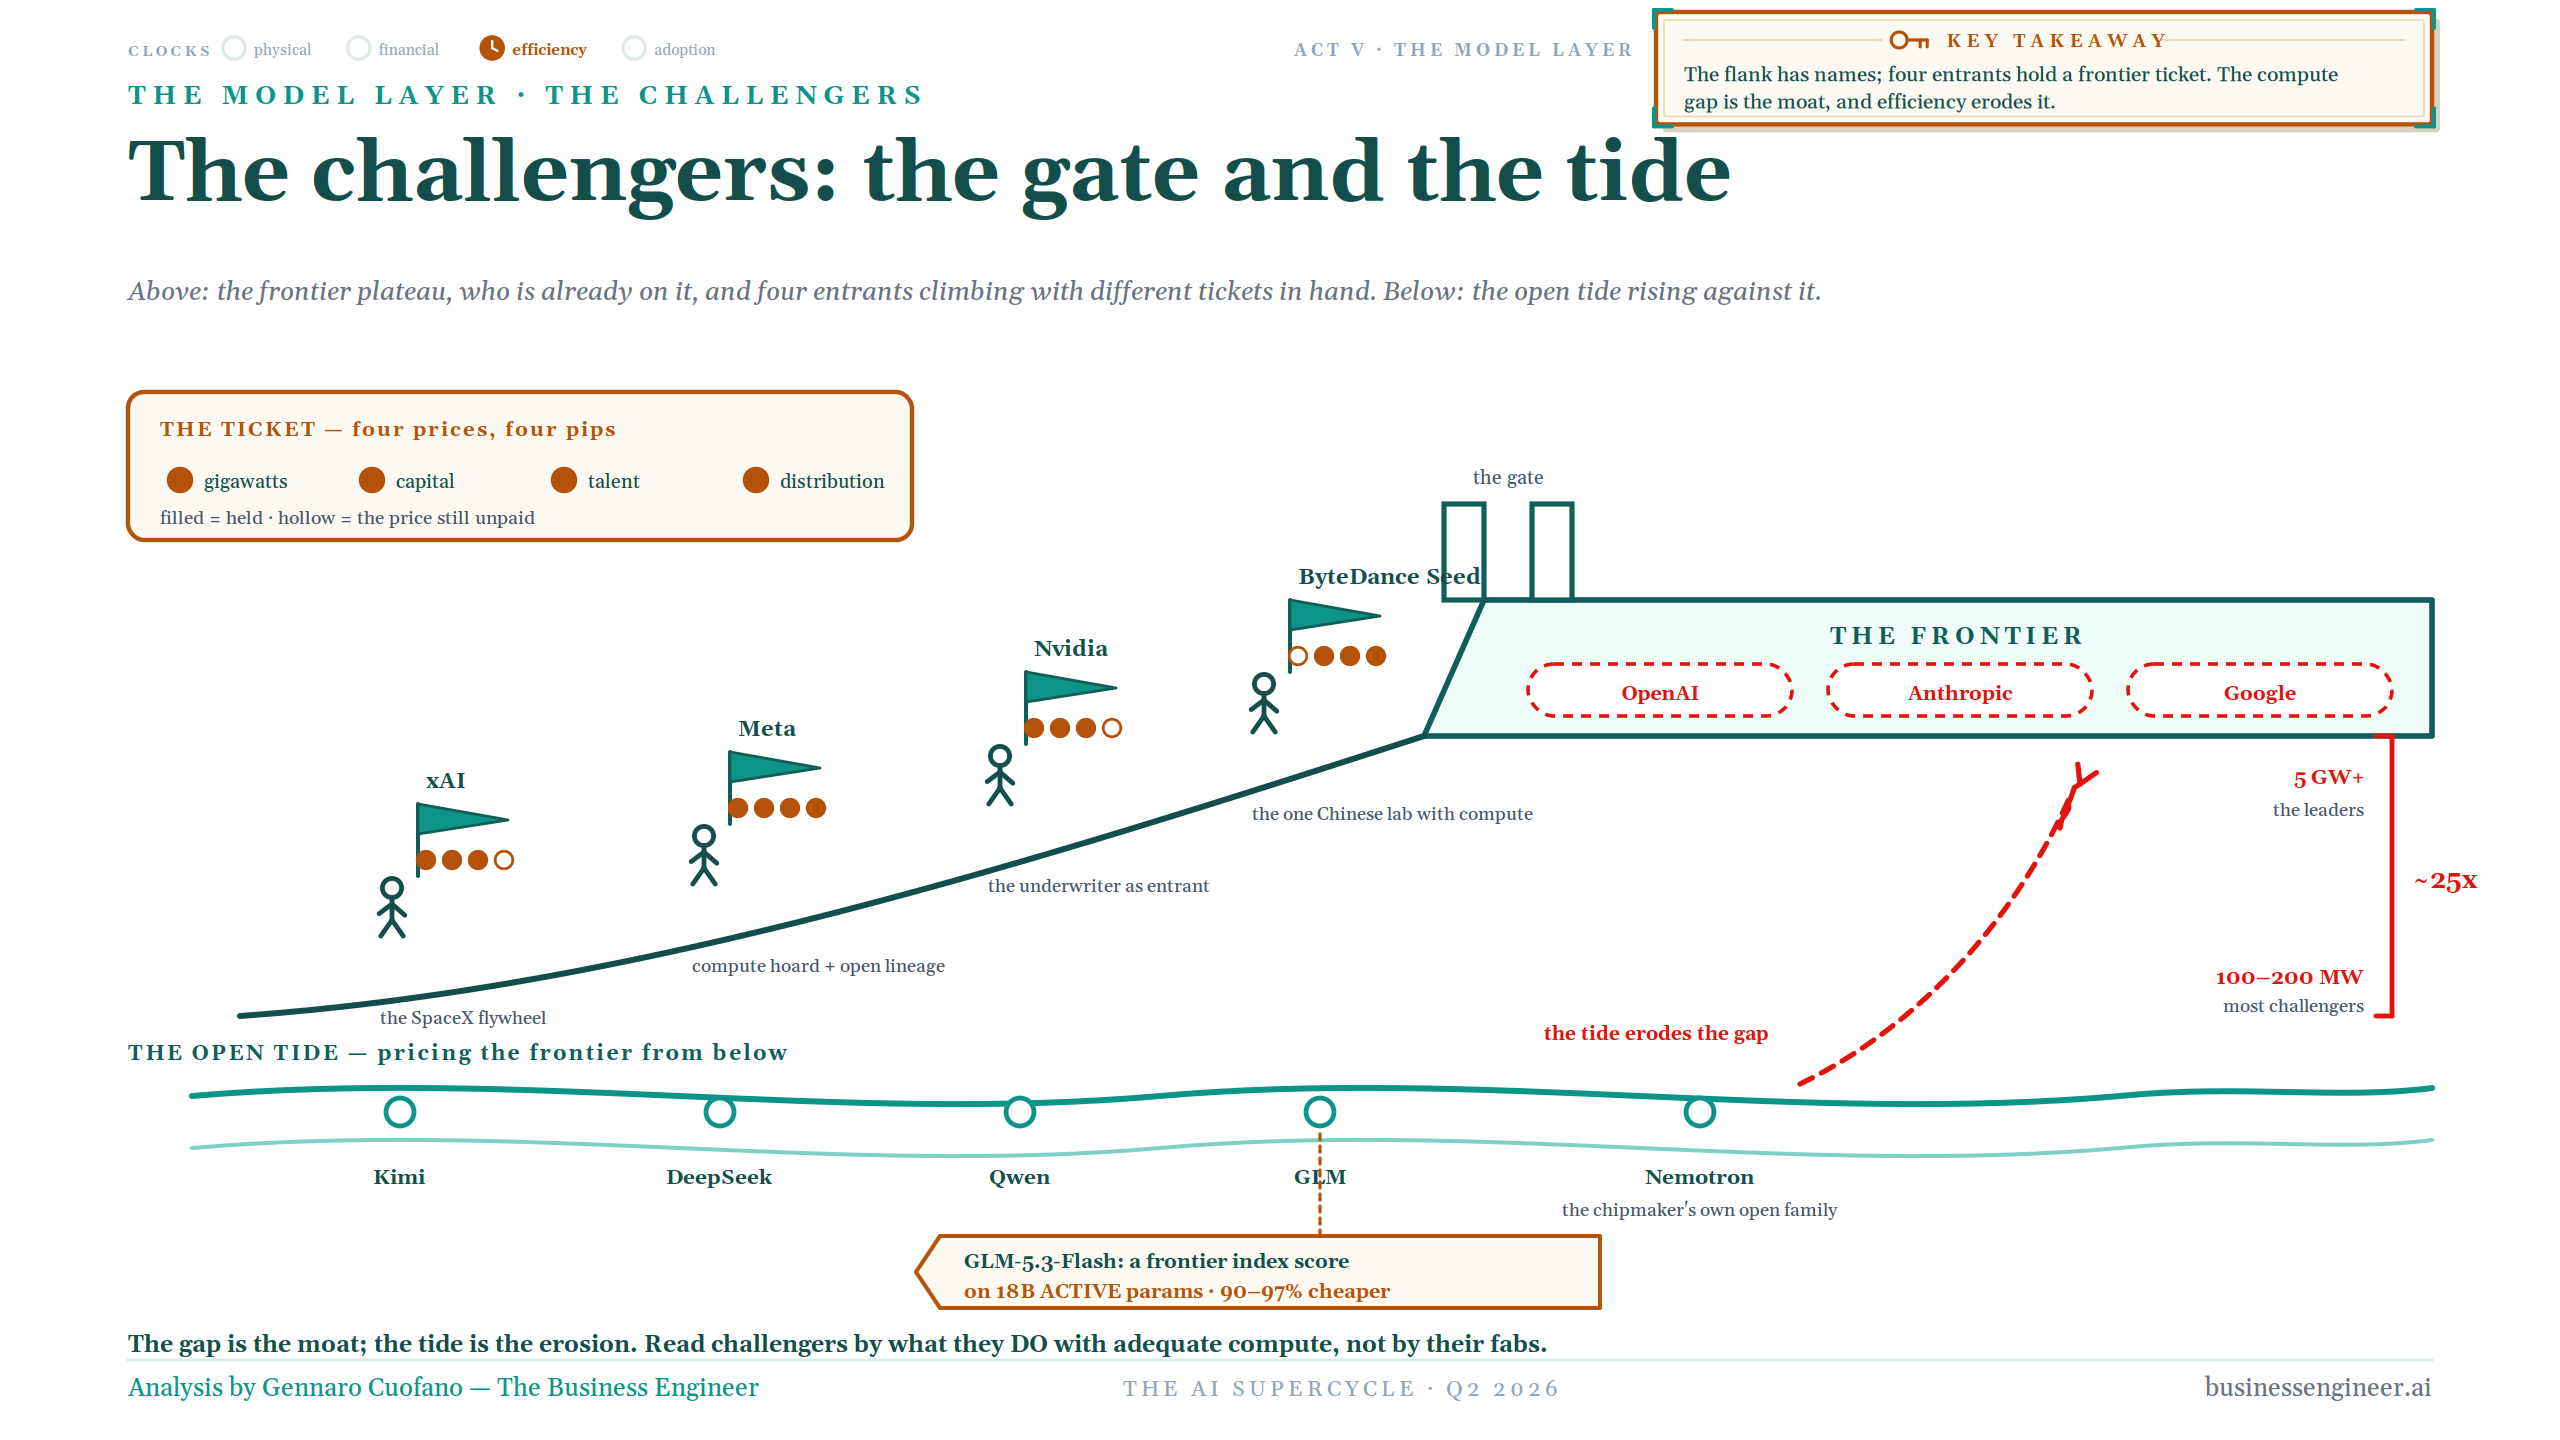
The frontier itself is also becoming easier to analyze. There is a gate. To reach it, a challenger needs some combination of gigawatts, capital, talent and distribution.
OpenAI, Anthropic and Google remain on the frontier plateau, operating at a scale measured in multiple gigawatts. Below them, new entrants are climbing with different tickets: xAI, Meta, NVIDIA, ByteDance and others.
But underneath the entire hill there is also a tide. Kimi. DeepSeek. Qwen. GLM. Nemotron.
The open ecosystem is repricing the frontier from below.
Selected open models can increasingly approach frontier benchmark performance while activating far fewer parameters and operating at a fraction of the cost on specific workloads. The exact gap varies enormously by benchmark and deployment, but the strategic dynamic is more important than any single percentage.
The gap is the moat. The tide is the erosion.
The frontier does not need to stop improving for its economics to compress. It only needs the open cohort to close enough of the gap that the marginal buyer no longer pays the old premium.
So the correct question about challengers is not simply how much compute they own. It is what they can do with adequate compute and how quickly those capabilities diffuse.
The harness turn
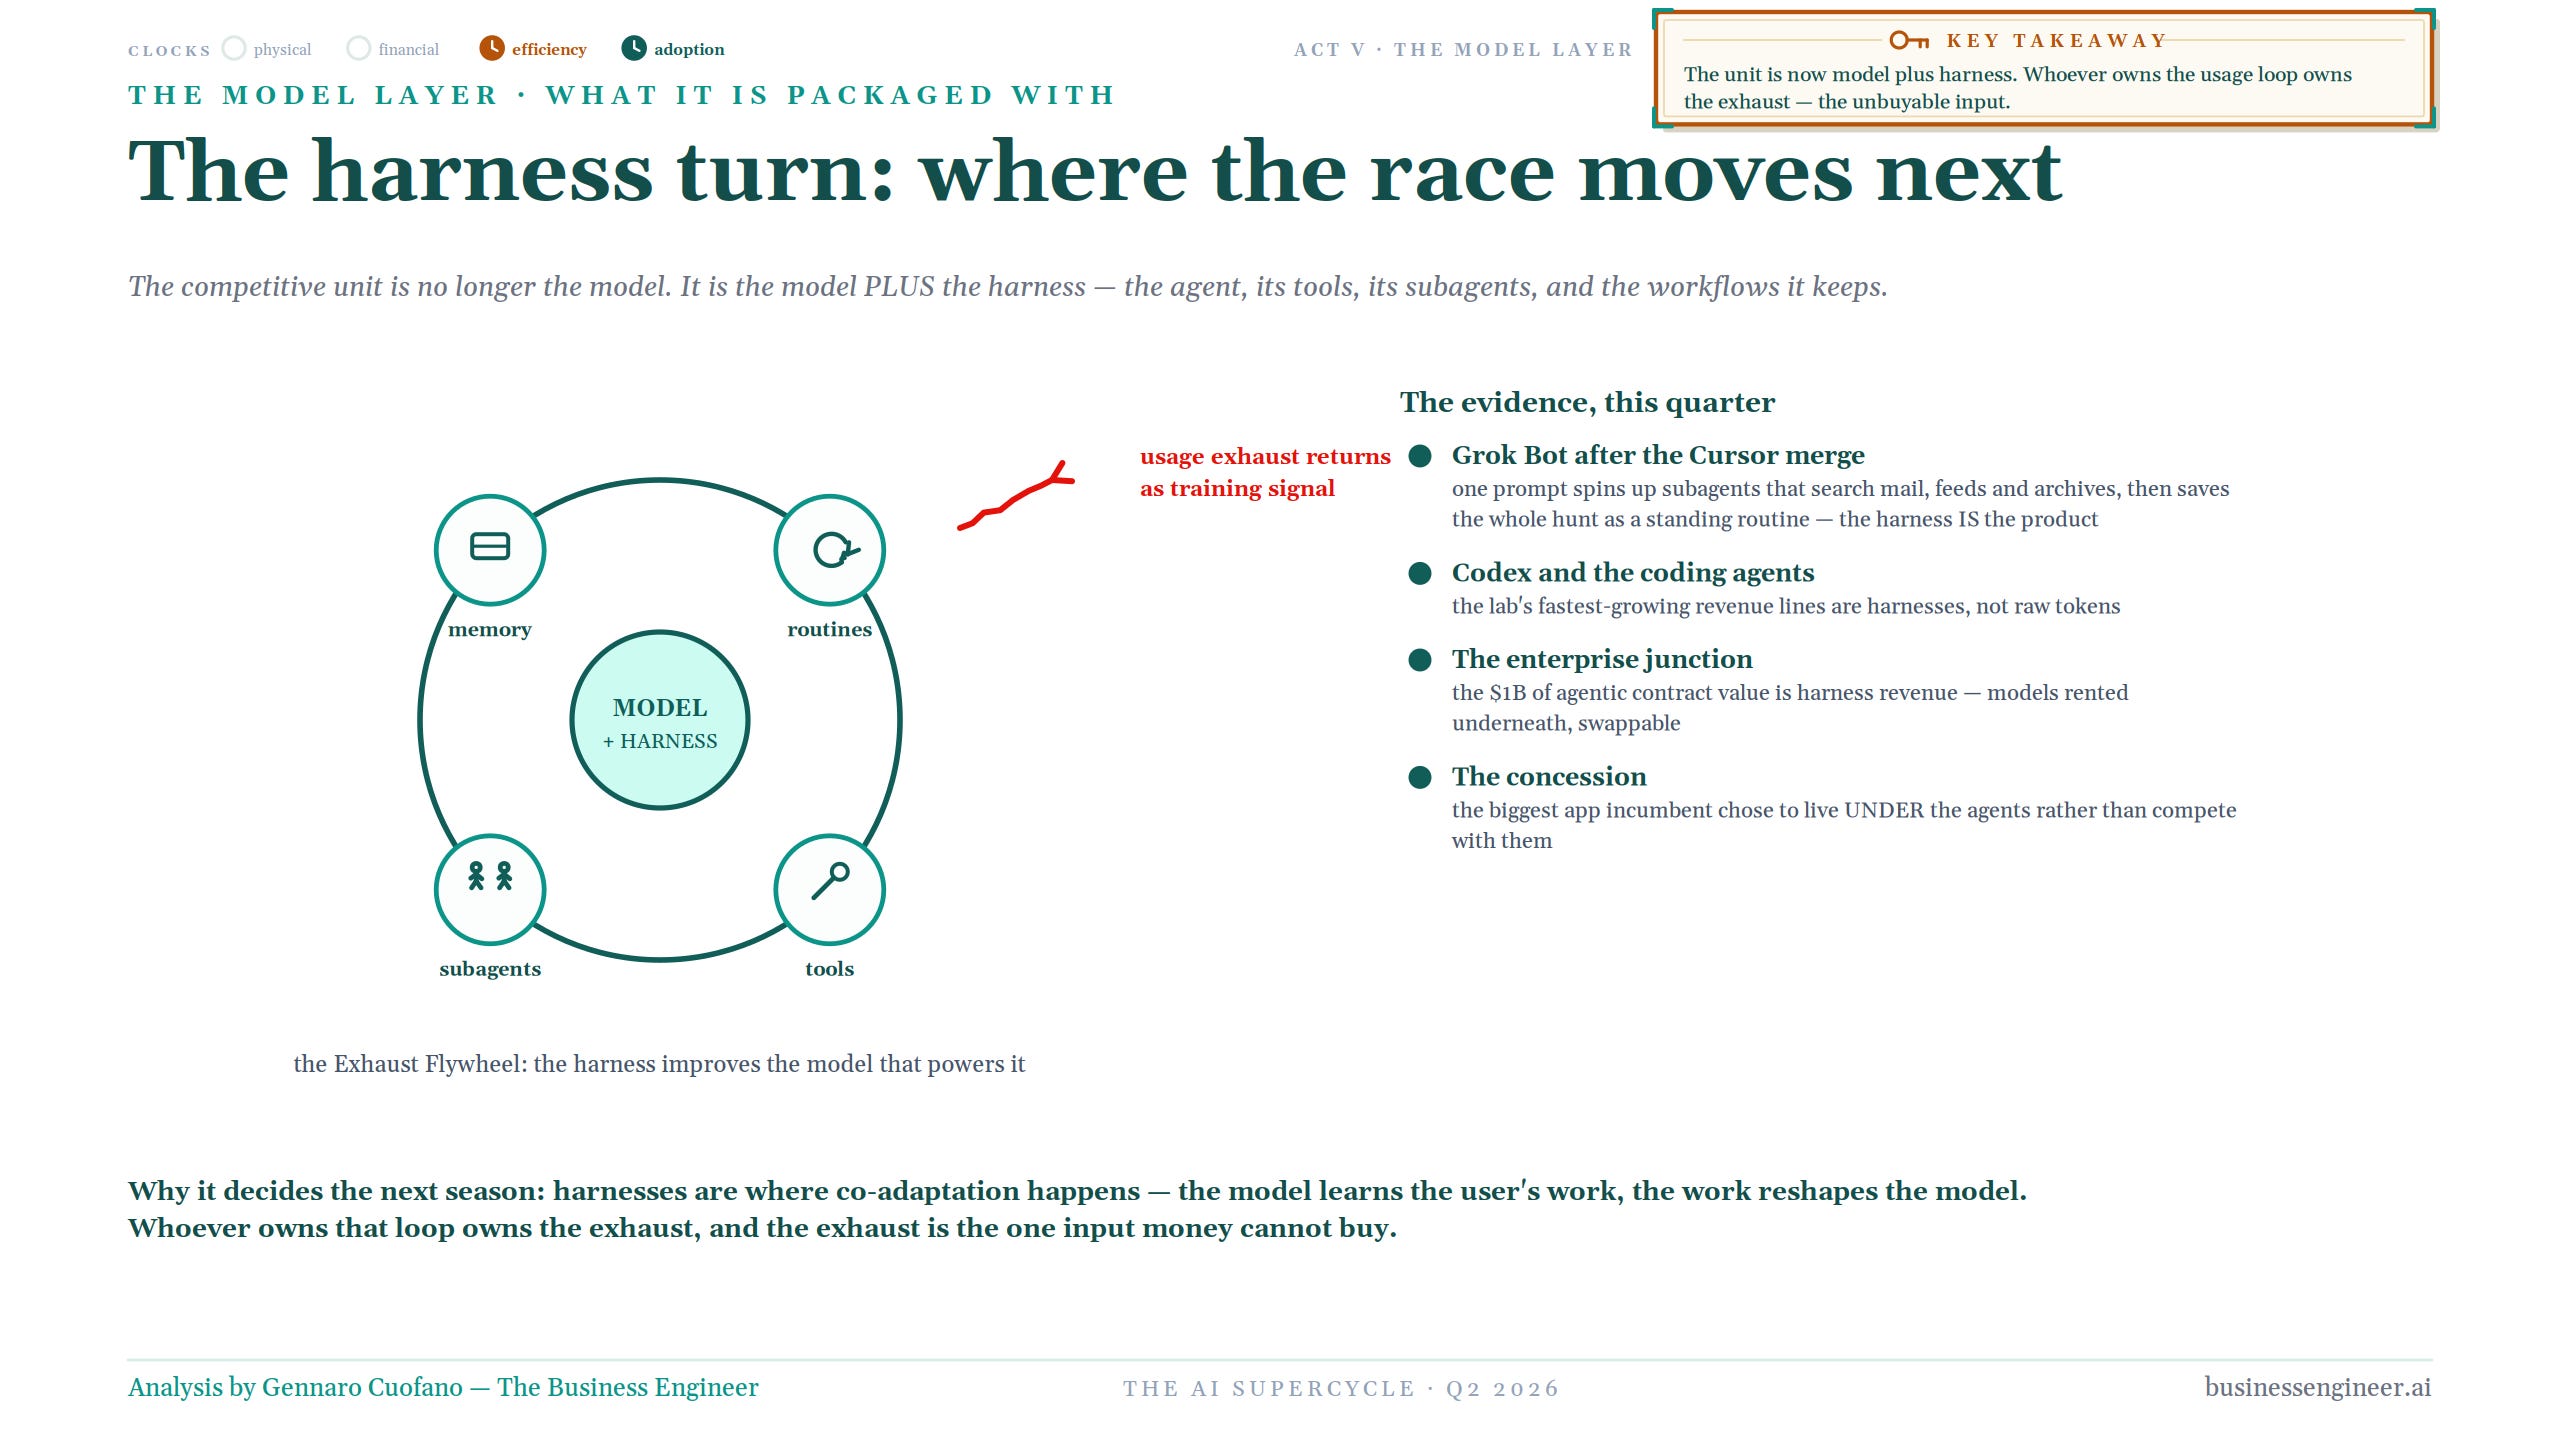
This is why the next race moves above the model. The competitive unit is increasingly not the model itself. It is the model plus the harness.
Memory. Routines. Tools. Subagents. Workflow state. Enterprise context. Permissions.
The harness changes the economics because it produces something the model provider cannot simply buy: usage exhaust.
The user works through the system. The system observes the work. That usage becomes context, routine, preference and eventually training signal. The harness improves the model that powers it. The better model improves the harness. And the loop compounds.
We can already see the pattern in coding agents, where the fastest-growing revenue lines increasingly belong to harnesses rather than raw token APIs. We can see it in systems where one prompt expands into a standing routine across search, mail, feeds and archives. We can see it at the enterprise junction, where large agentic contracts increasingly pay for orchestration, governance, context and tools while the underlying model remains replaceable.
And we can see it in incumbent enterprise software, where the strategic concession is increasingly to live under the agent rather than insist on remaining the interface the human sees.
That is why the harness matters.
Whoever owns the usage loop owns the exhaust. And the exhaust is the input money cannot buy.
The alliance is the unit of competition
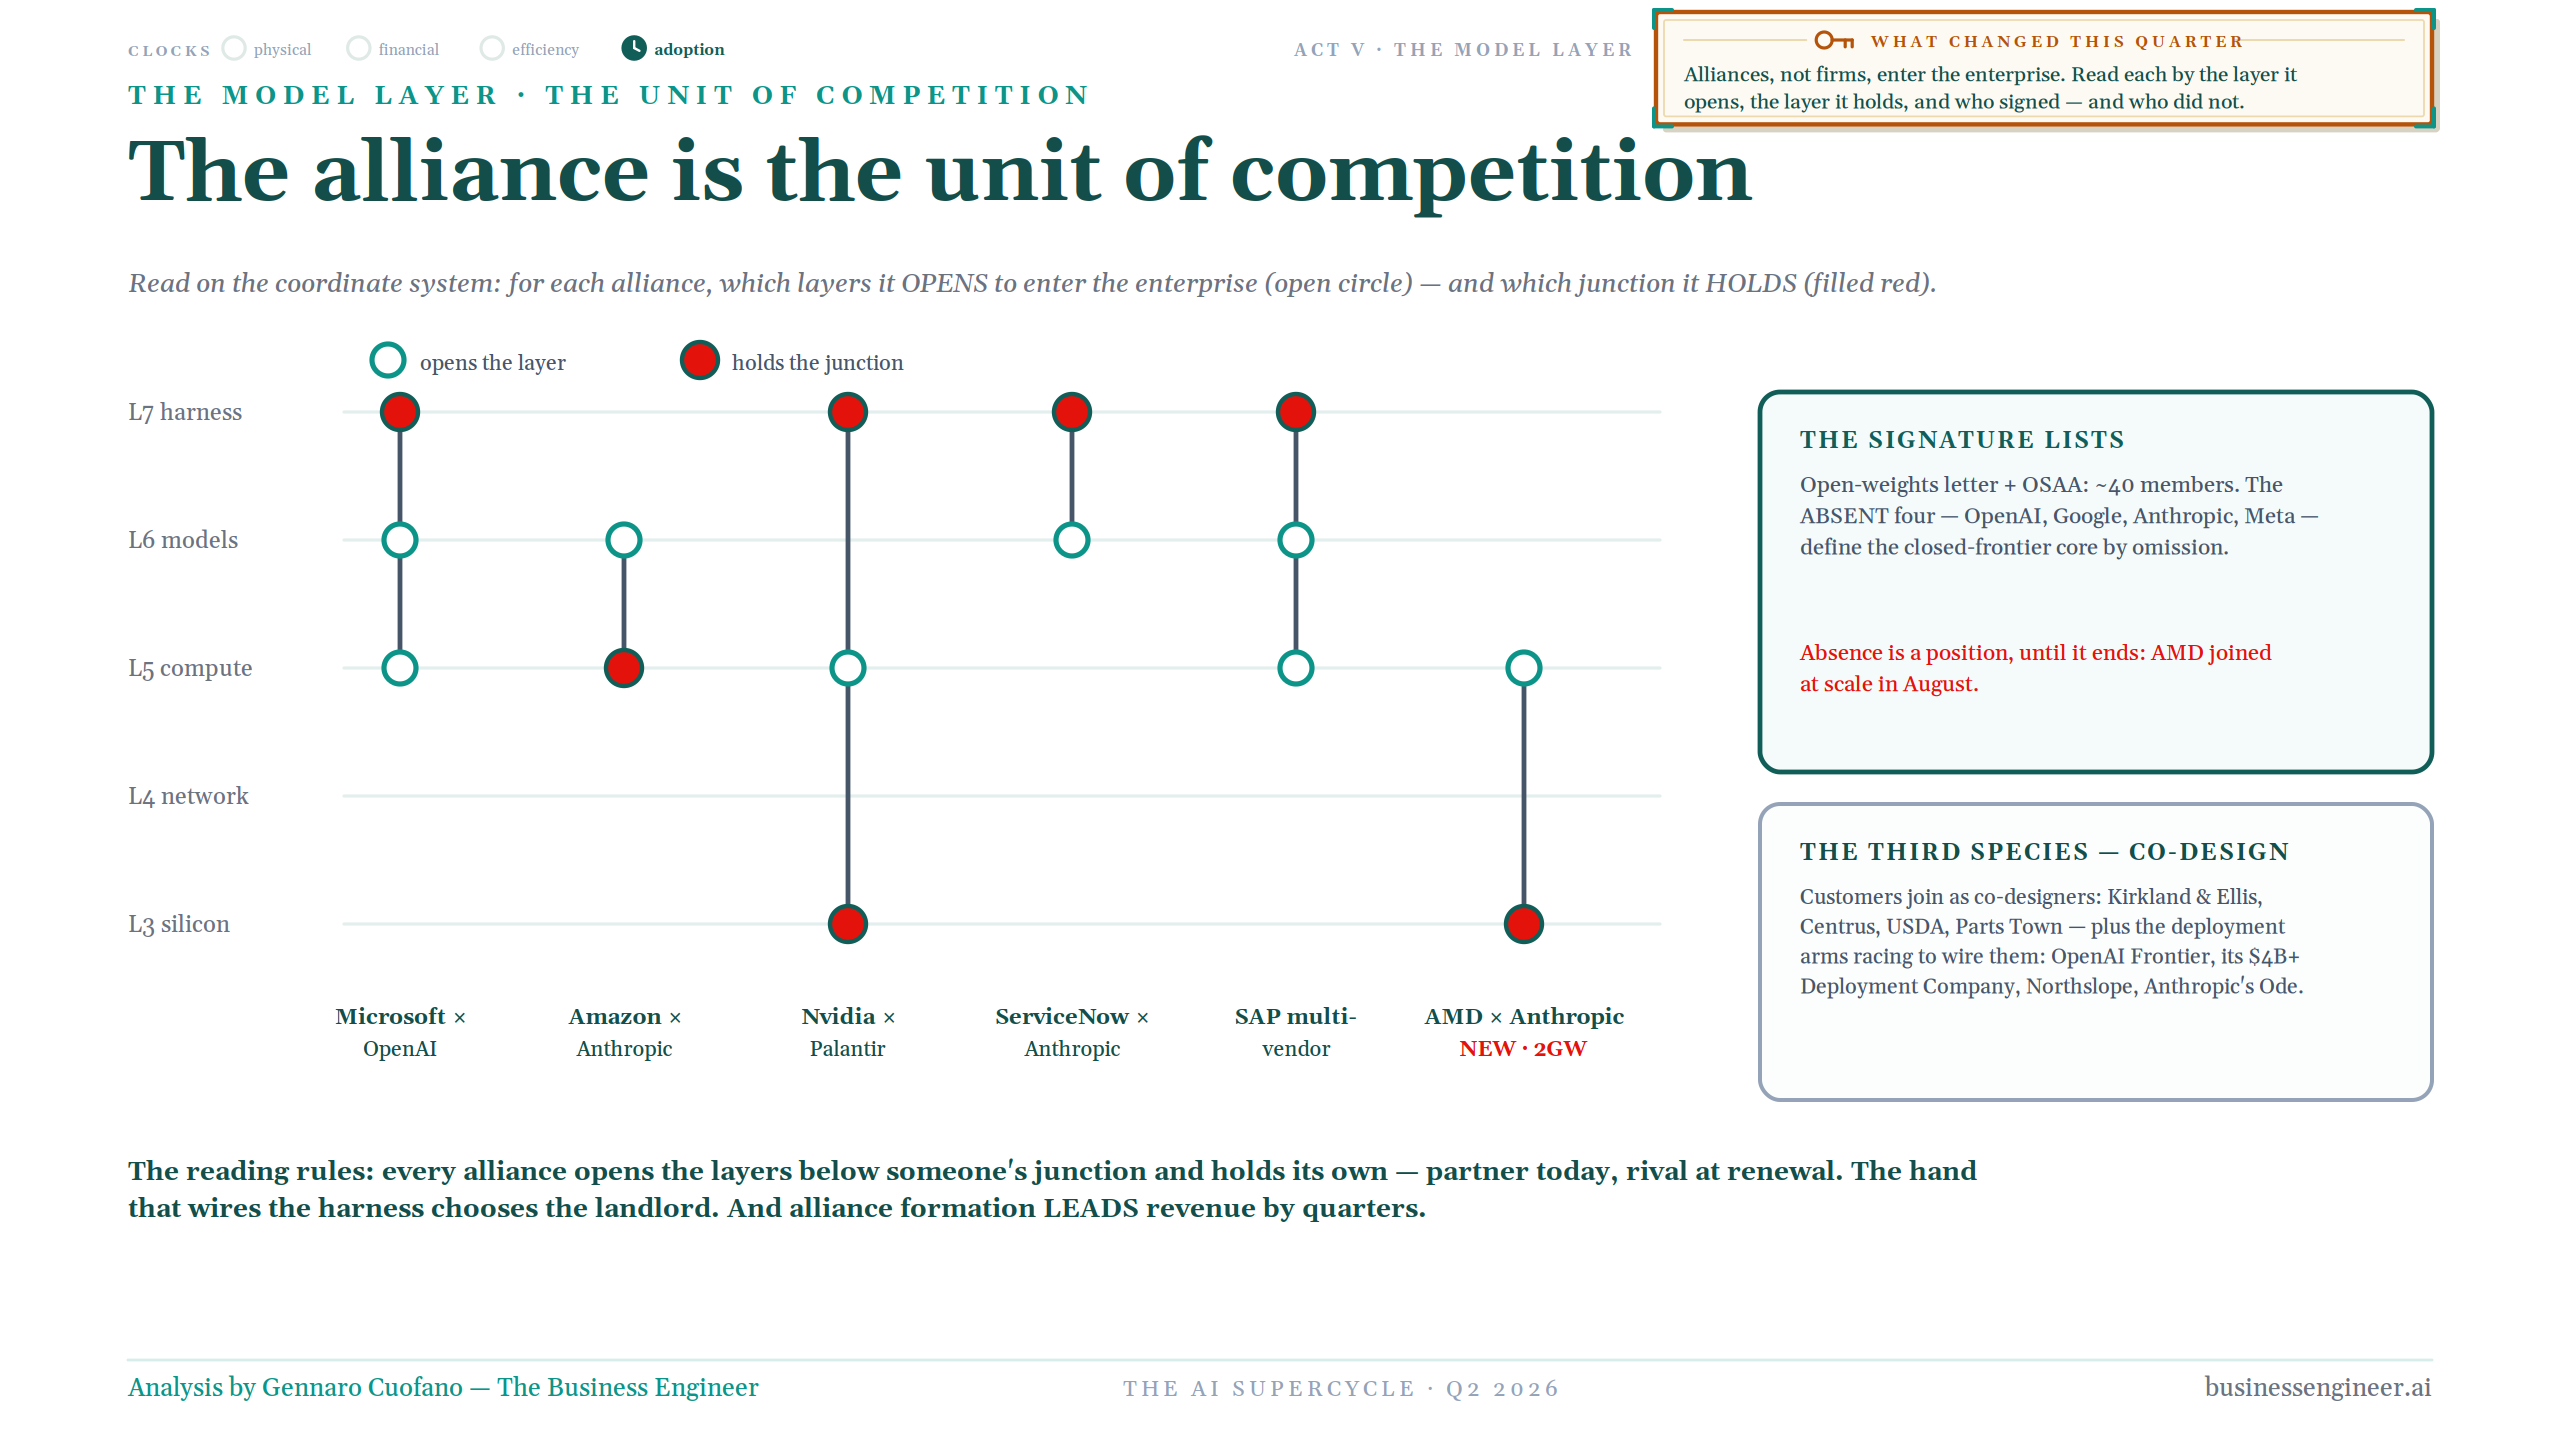
Once models become more portable and the harness becomes more important, the unit of competition changes again. It is increasingly not the firm. It is the alliance.
Microsoft and OpenAI. Amazon and Anthropic. NVIDIA and Palantir. ServiceNow and Anthropic. SAP with multiple vendors. AMD and Anthropic.
Each alliance should be read as an architectural choice. Which layers does the alliance want opened? Which layer does each participant intend to hold? Where is the junction? Who needs the layer beneath them to commoditize? Who is absent from the coalition?
The signature lists are often more informative than the press release. An open-weight coalition containing dozens of participants but excluding OpenAI, Google, Anthropic and Meta tells you something about where the closed frontier believes its value lies.
And absence itself can be a strategic position. Until it ends.
AMD supplied the example this quarter by joining at scale.
There is also a third species emerging inside these alliances: co-design. Customers stop acting purely as buyers and begin acting as participants in the intelligence architecture itself. They bring domain data, workflows and operating context into the build.
That matters because the hand that wires the harness may ultimately decide who owns the junction.
Partner today. Rival at renewal.
Alliance formation leads revenue by quarters.
THE CEILING
The ceiling finally has a number
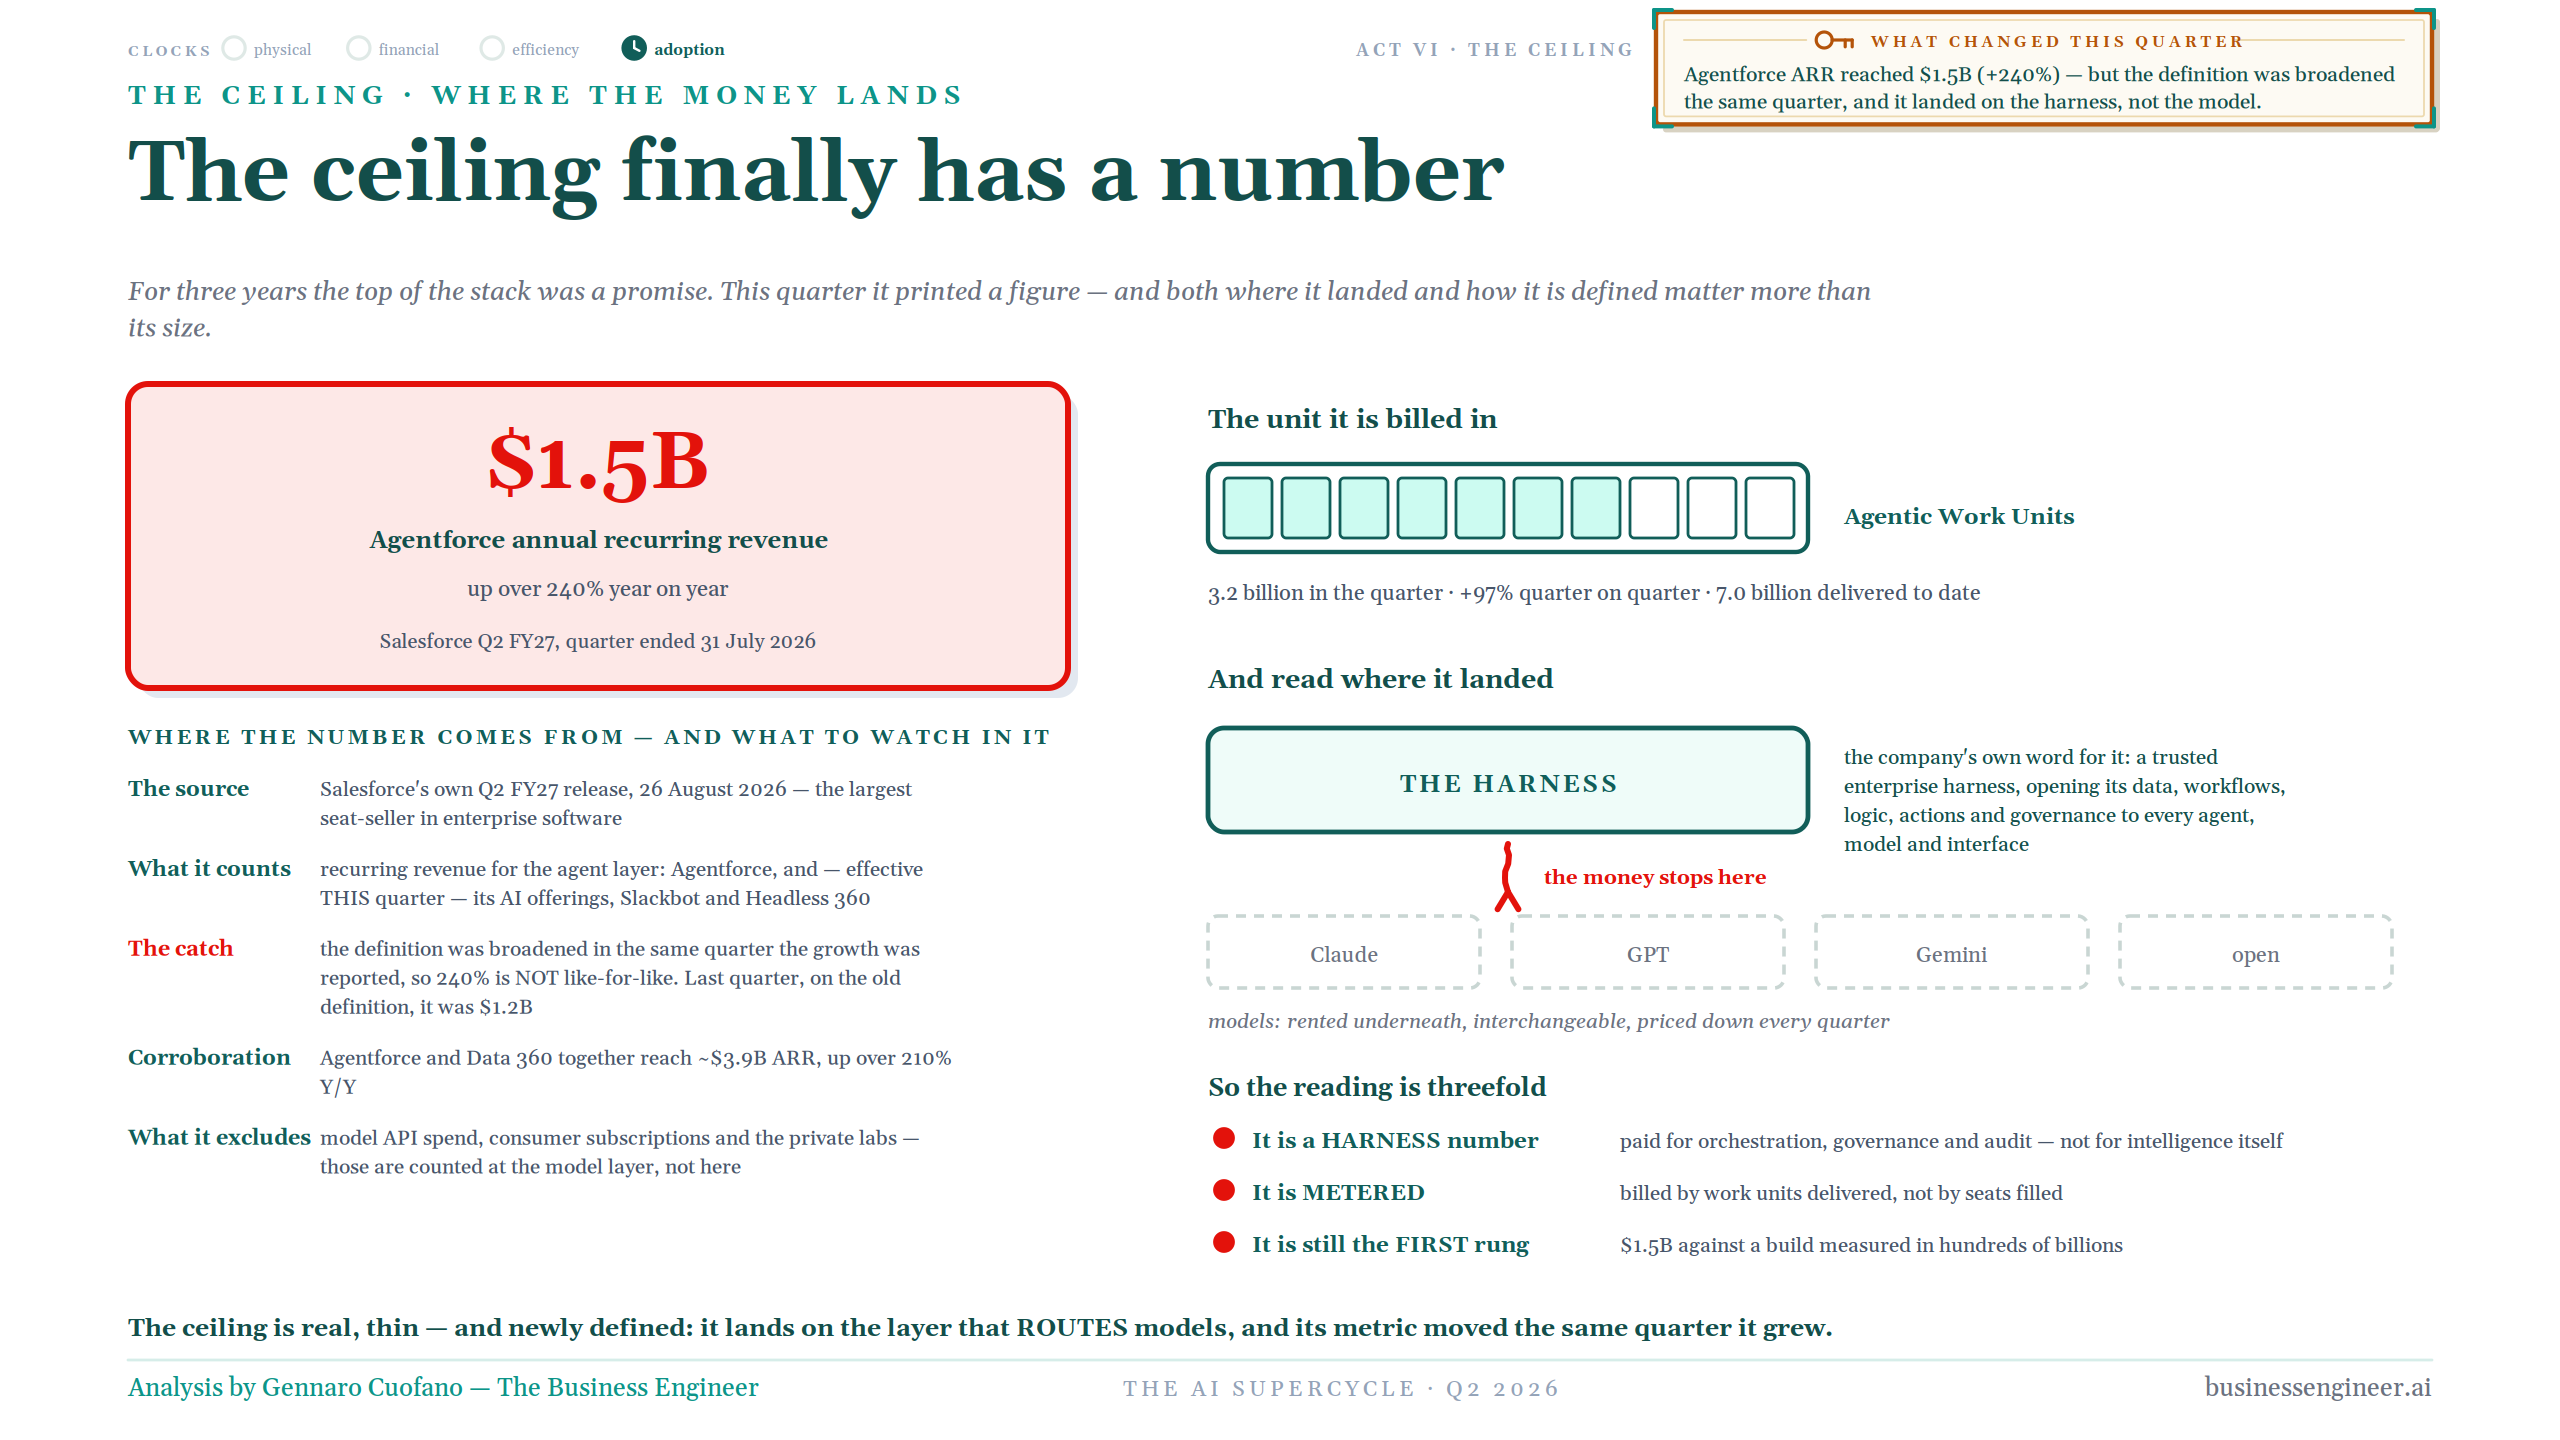
For three years, the top of the AI stack was mostly a promise. This quarter, it printed a number: Agentforce reached $1.5 billion of annual recurring revenue, up more than 240% year over year. But the headline needs to be read carefully. Salesforce broadened the definition in the same quarter, folding its broader AI offerings into the metric. On the prior definition, the number would have been closer to $1.2 billion. So the important signal is not simply the size or the growth rate. It is where the revenue landed, and what customers are actually paying for.
It did not land at the model. It landed at the harness: Salesforce’s own description of the trusted enterprise layer that connects data, workflows, logic, actions and governance to every agent, model and interface. Claude, GPT, Gemini and open models sit underneath as increasingly rentable and interchangeable inputs. The economic relationship is therefore becoming clearer: the intelligence can be rented; the orchestration layer can be owned. The money stops at the harness.
The unit of monetization is changing too. Agentforce is increasingly billed through Agentic Work Units, not simply through seats. Salesforce delivered 3.2 billion work units in the quarter, up 97% quarter over quarter, and 7.0 billion cumulatively. That matters because it gives us one of the first large-scale public examples of the transition from software priced around human access to software priced around machine work. The meter is beginning to follow the action.
So I read the $1.5 billion in three ways. First, it is a harness number: customers are paying for orchestration, governance, tools and enterprise context, not for intelligence in isolation. Second, it is metered: the economic unit is increasingly work performed rather than seats filled. Third, it is still only the first rung: $1.5 billion is meaningful proof that the ceiling can monetize, but it remains small against an infrastructure build measured in hundreds of billions.
That is the real signal from the quarter. The ceiling is real, but still thin, and it is becoming more clearly defined: value is landing on the layer that routes and governs the models, while the models themselves increasingly sit underneath as rentable supply.
Above the model, everything is being rebuilt
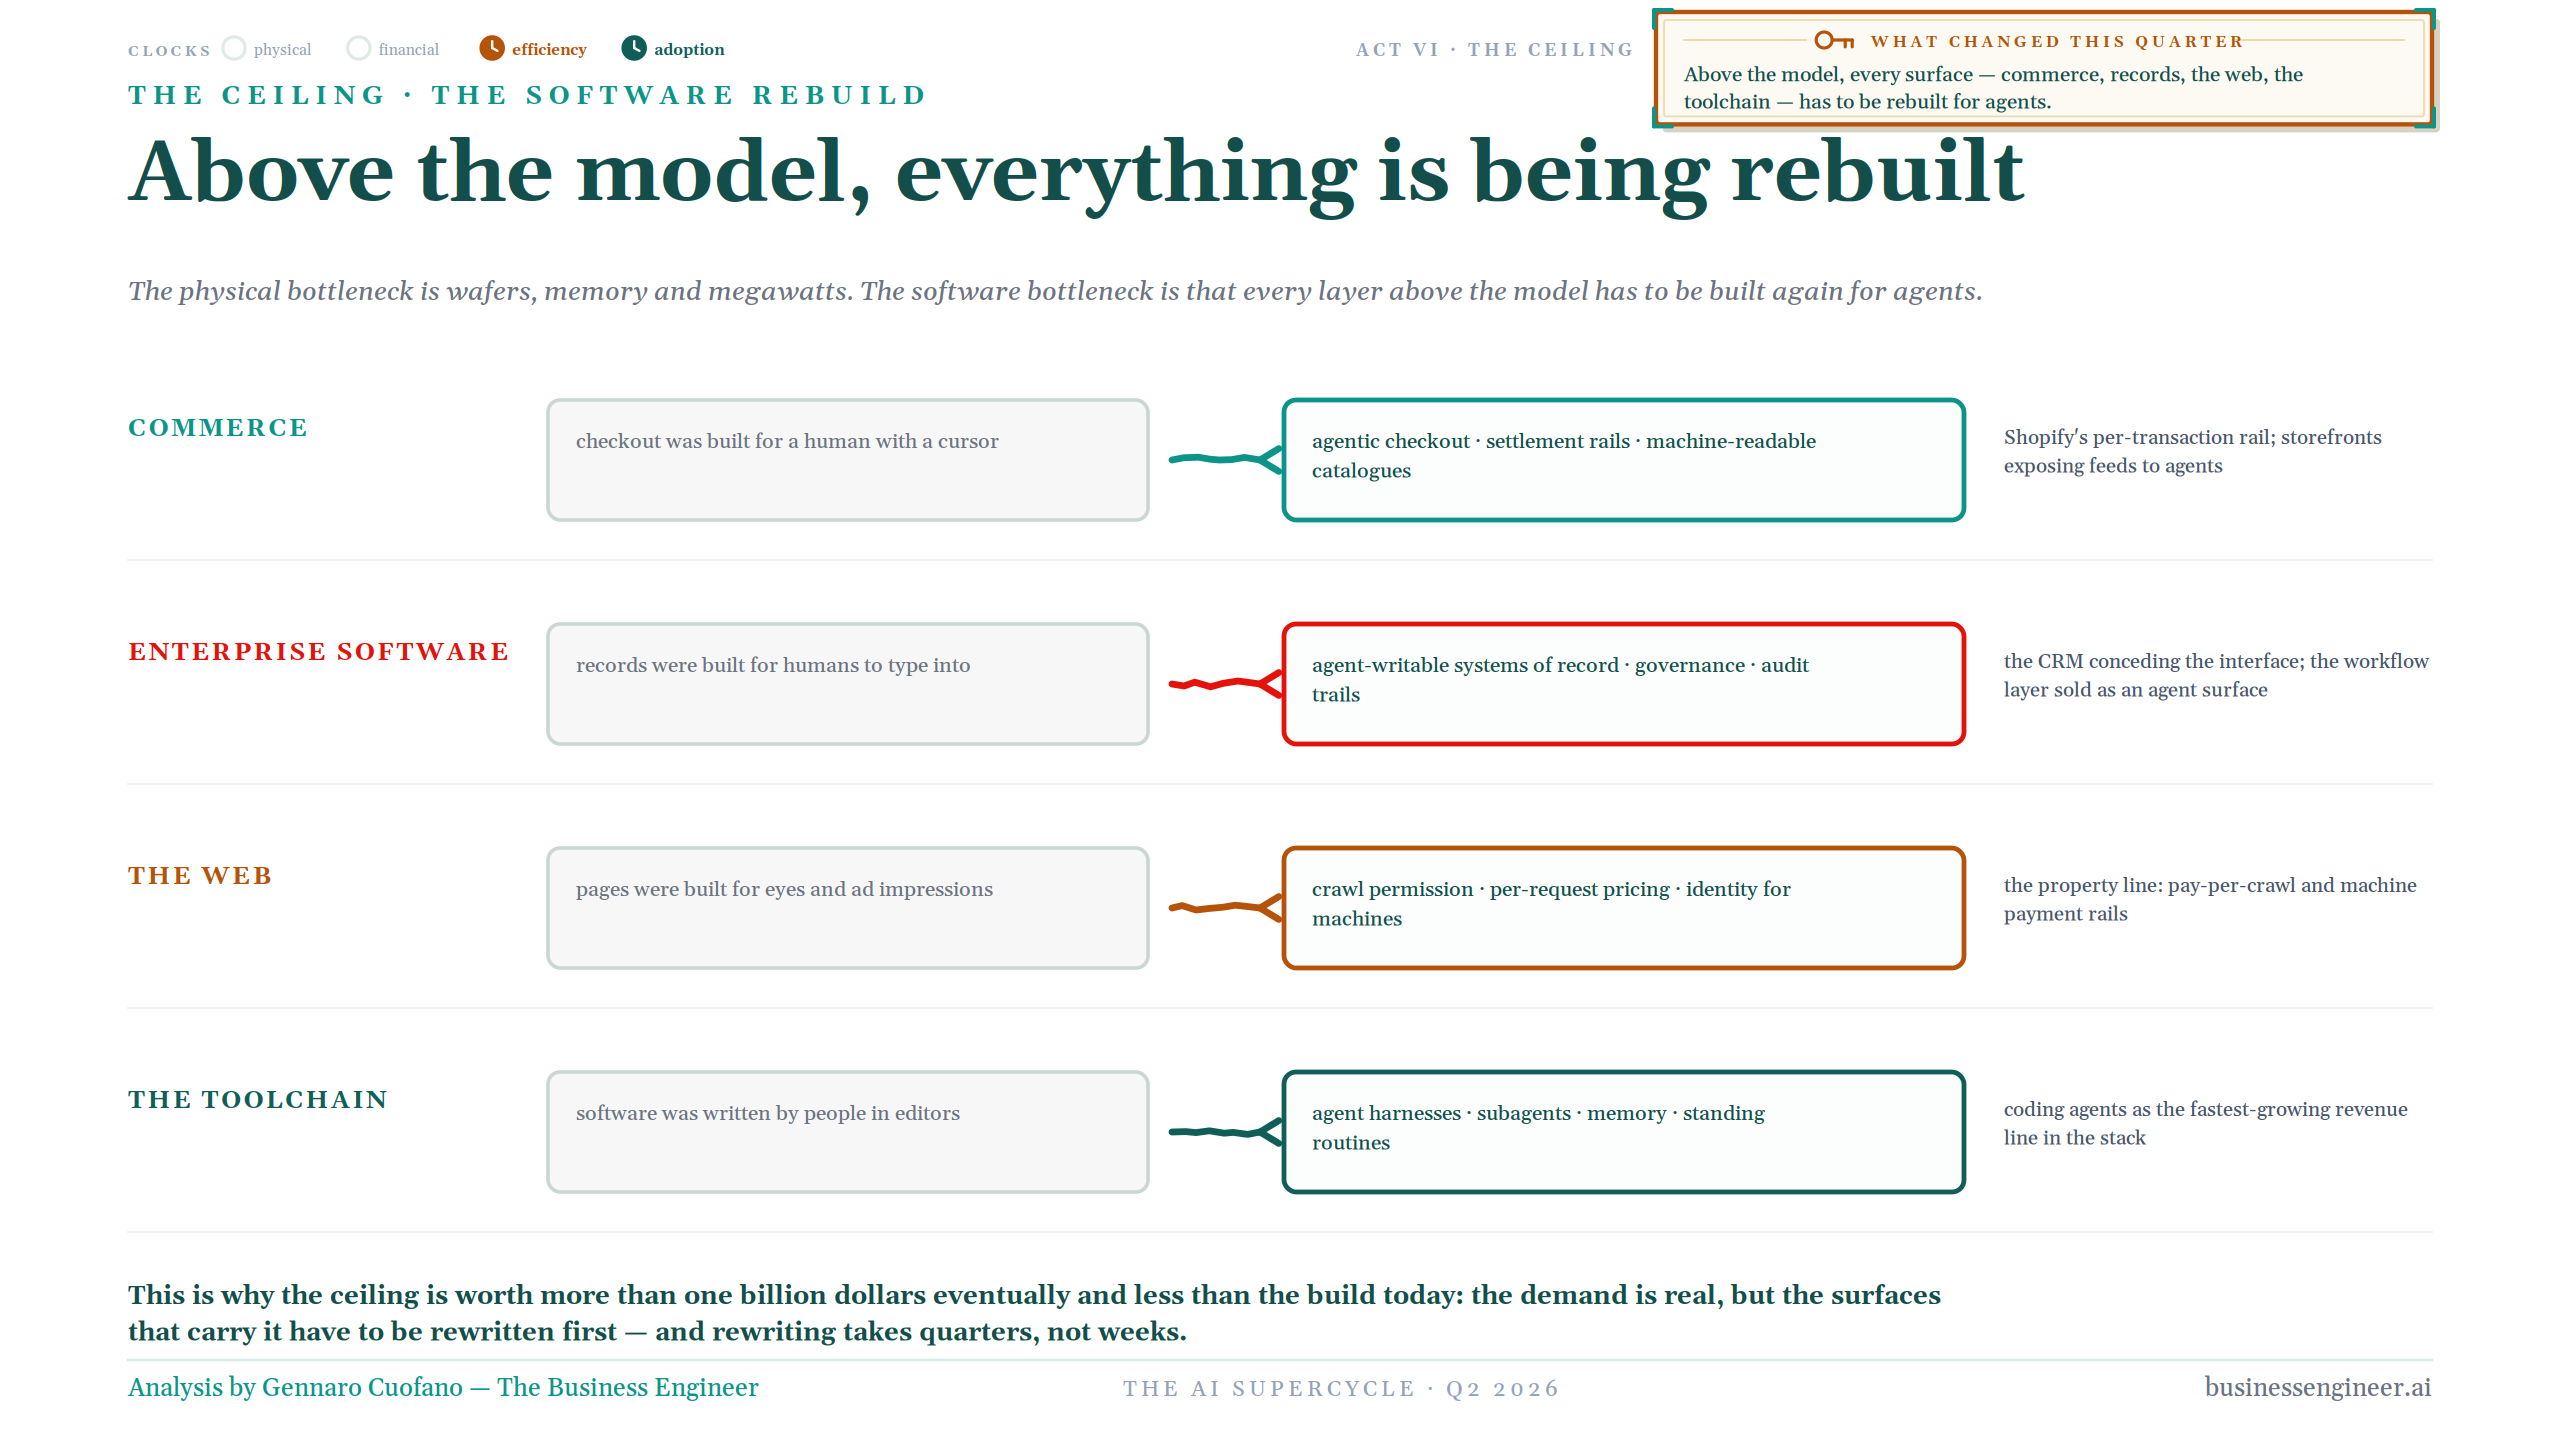
This helps explain why adoption remains the slowest clock. The model may already be capable. The surfaces above it are not.
In commerce, checkout was built for a human holding a cursor. Agentic commerce requires machine-readable catalogs, settlement rails and systems designed for software to transact.
In enterprise software, systems of record were built for humans to type into. An agentic enterprise requires systems that agents can write to, with governance and audit trails around the actions.
On the web, pages were built for human eyes and advertising impressions. An agentic web needs crawl permissions, per-request pricing, identity for machines and eventually new payment rails.
In the toolchain, software was written by people sitting inside editors. The new substrate increasingly consists of agent harnesses, subagents, memory and persistent routines.
That is why the application ceiling can ultimately be worth much more than a billion dollars while still monetizing much less than the infrastructure base underneath it today.
The demand exists. But the surfaces that carry the demand have to be rewritten first.
And software rewrites take quarters, not weeks.
From SaaS to AGaaS
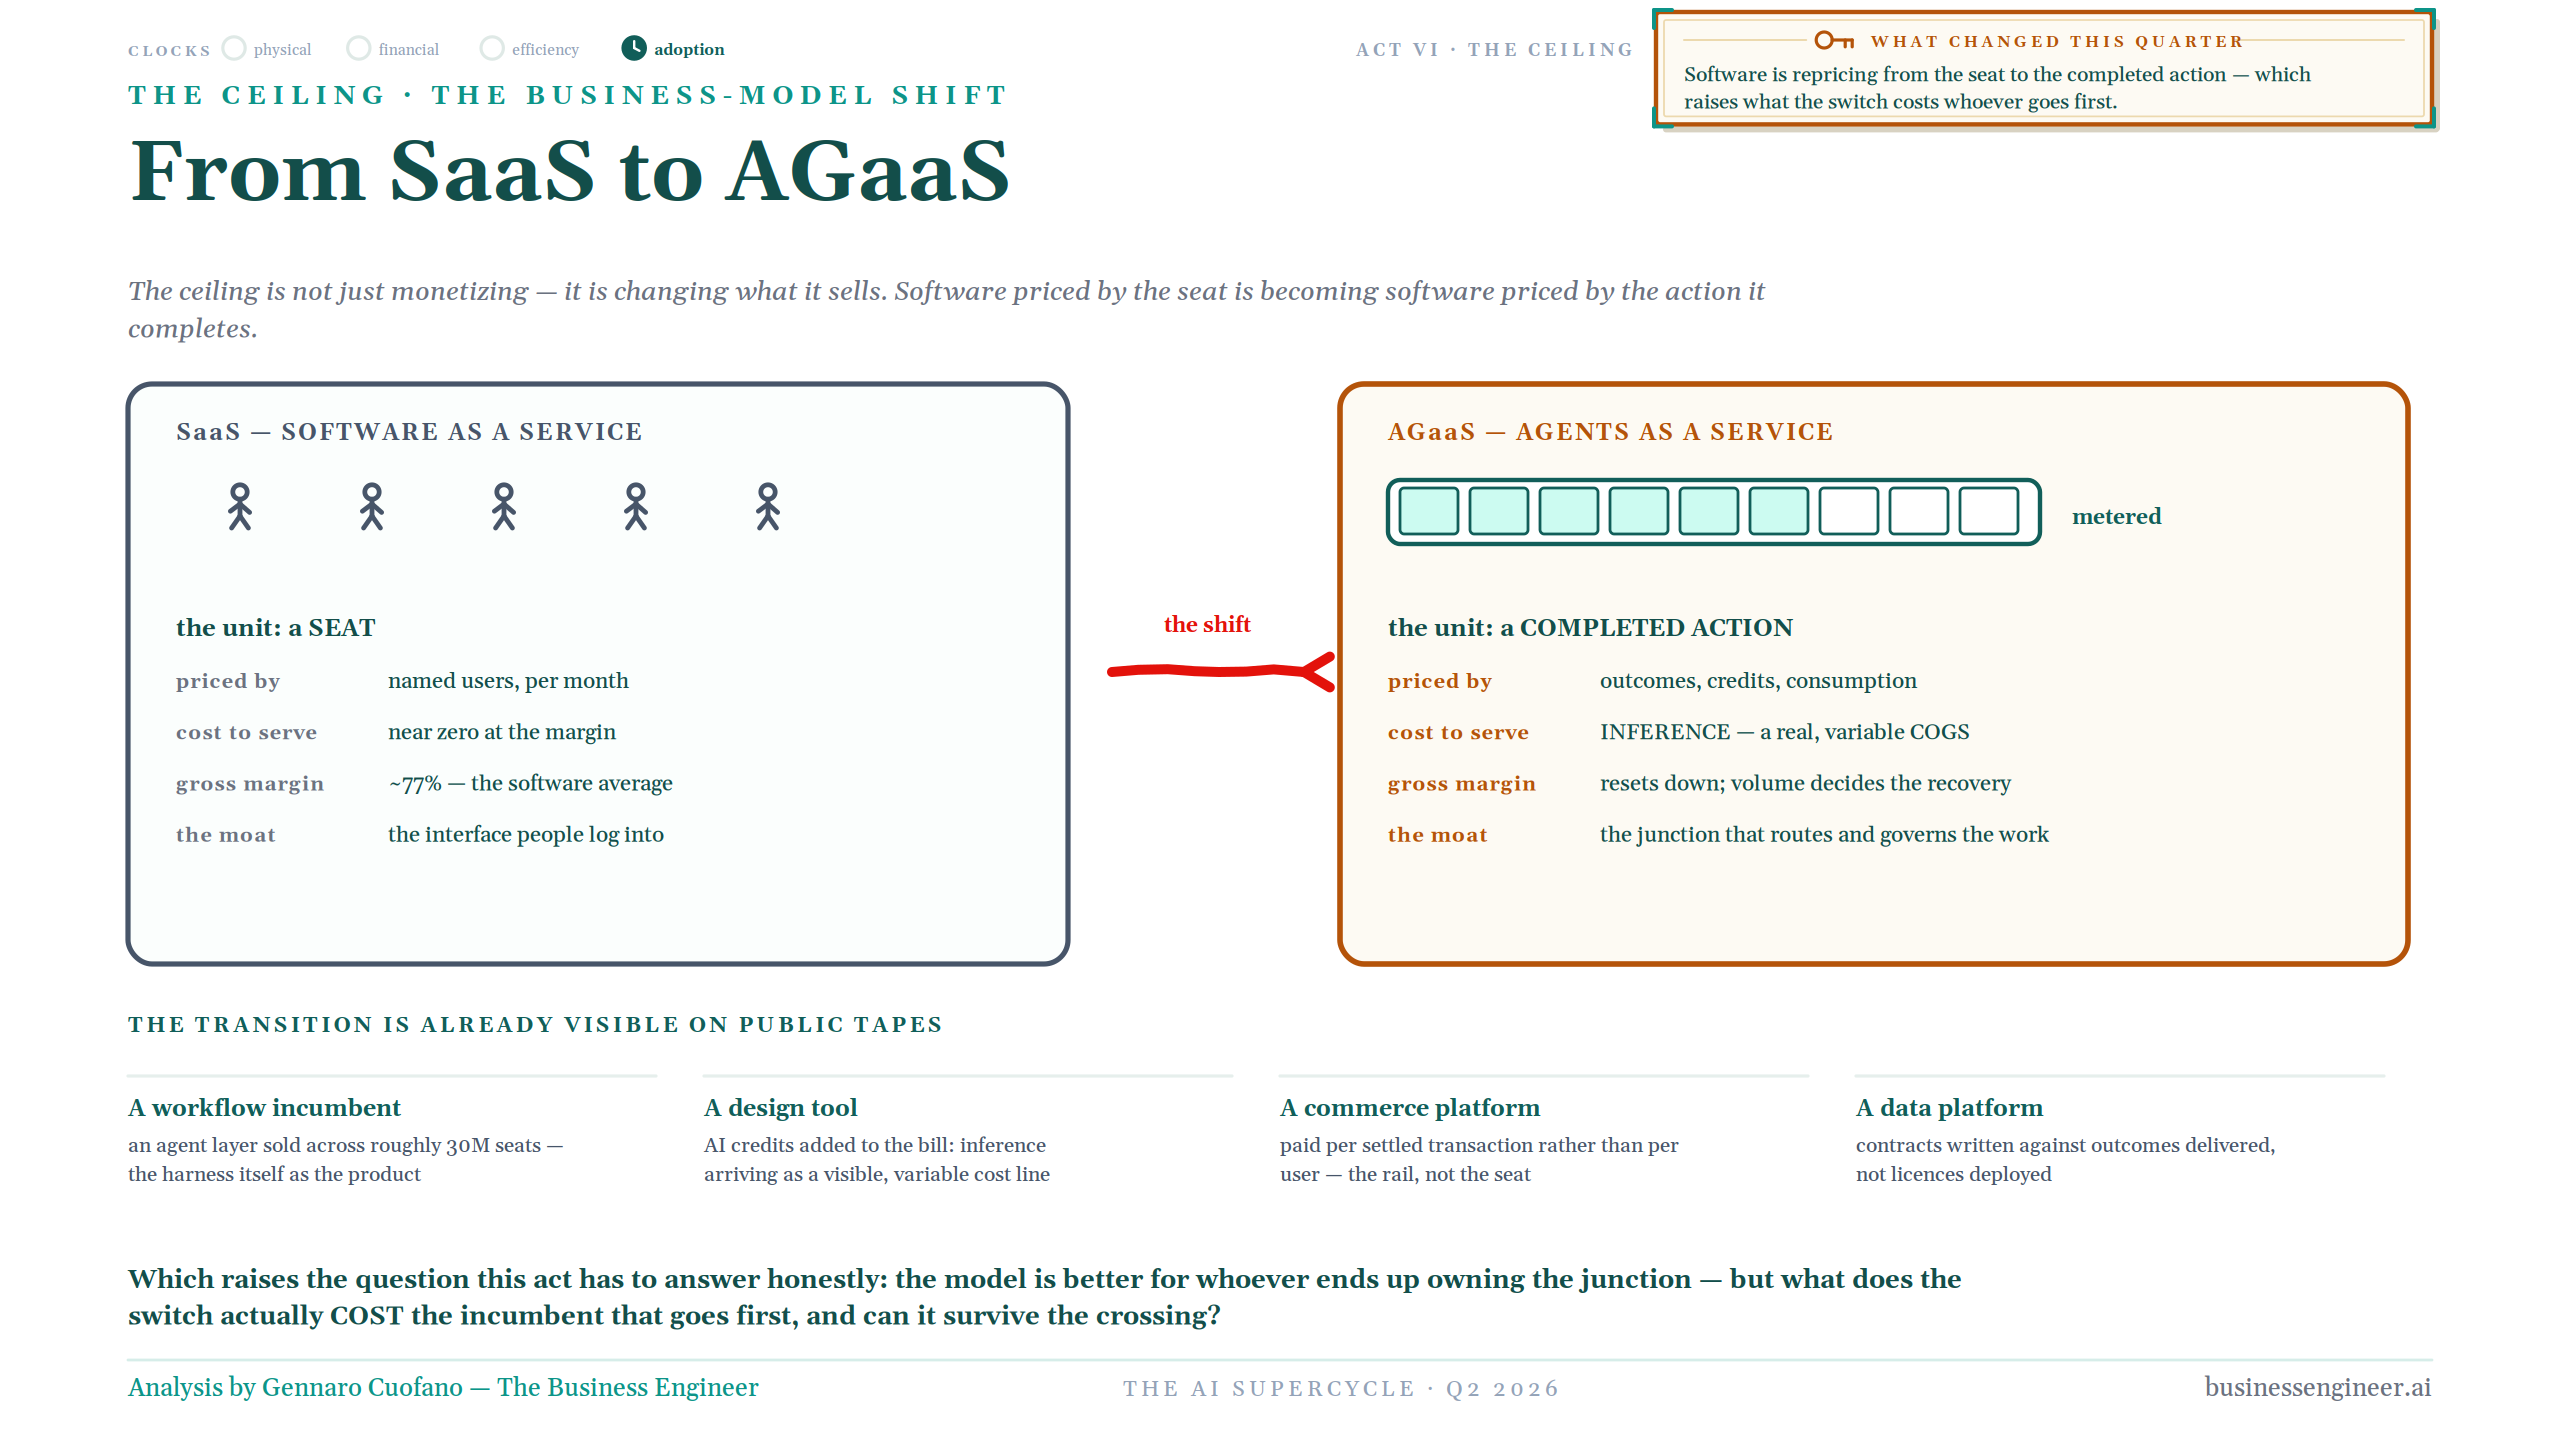
The business model changes with the architecture. SaaS was built around a simple unit: the seat. A named human used the software. The vendor charged per user, per month. The marginal cost to serve that additional seat was often close to zero. Gross margin around 77% became normal. The interface itself was the moat because humans logged into it.
Agentic software changes all four variables.
The unit becomes the completed action. Pricing moves toward outcomes, credits and consumption. The cost to serve now includes inference, which is real and variable. Gross margin resets lower, and scale has to earn it back. The moat moves away from the screen and toward the junction that routes and governs the work.
That is the transition from Software as a Service to Agents as a Service, AGaaS.
And it is no longer theoretical. Workflow software is already selling agent layers across tens of millions of seats. Design platforms increasingly add AI credits directly to the bill. Commerce platforms monetize settlement rather than simply the user account. Data platforms are experimenting with contracts tied to outcomes rather than licenses deployed.
The unit of software is changing.
What the crossing costs
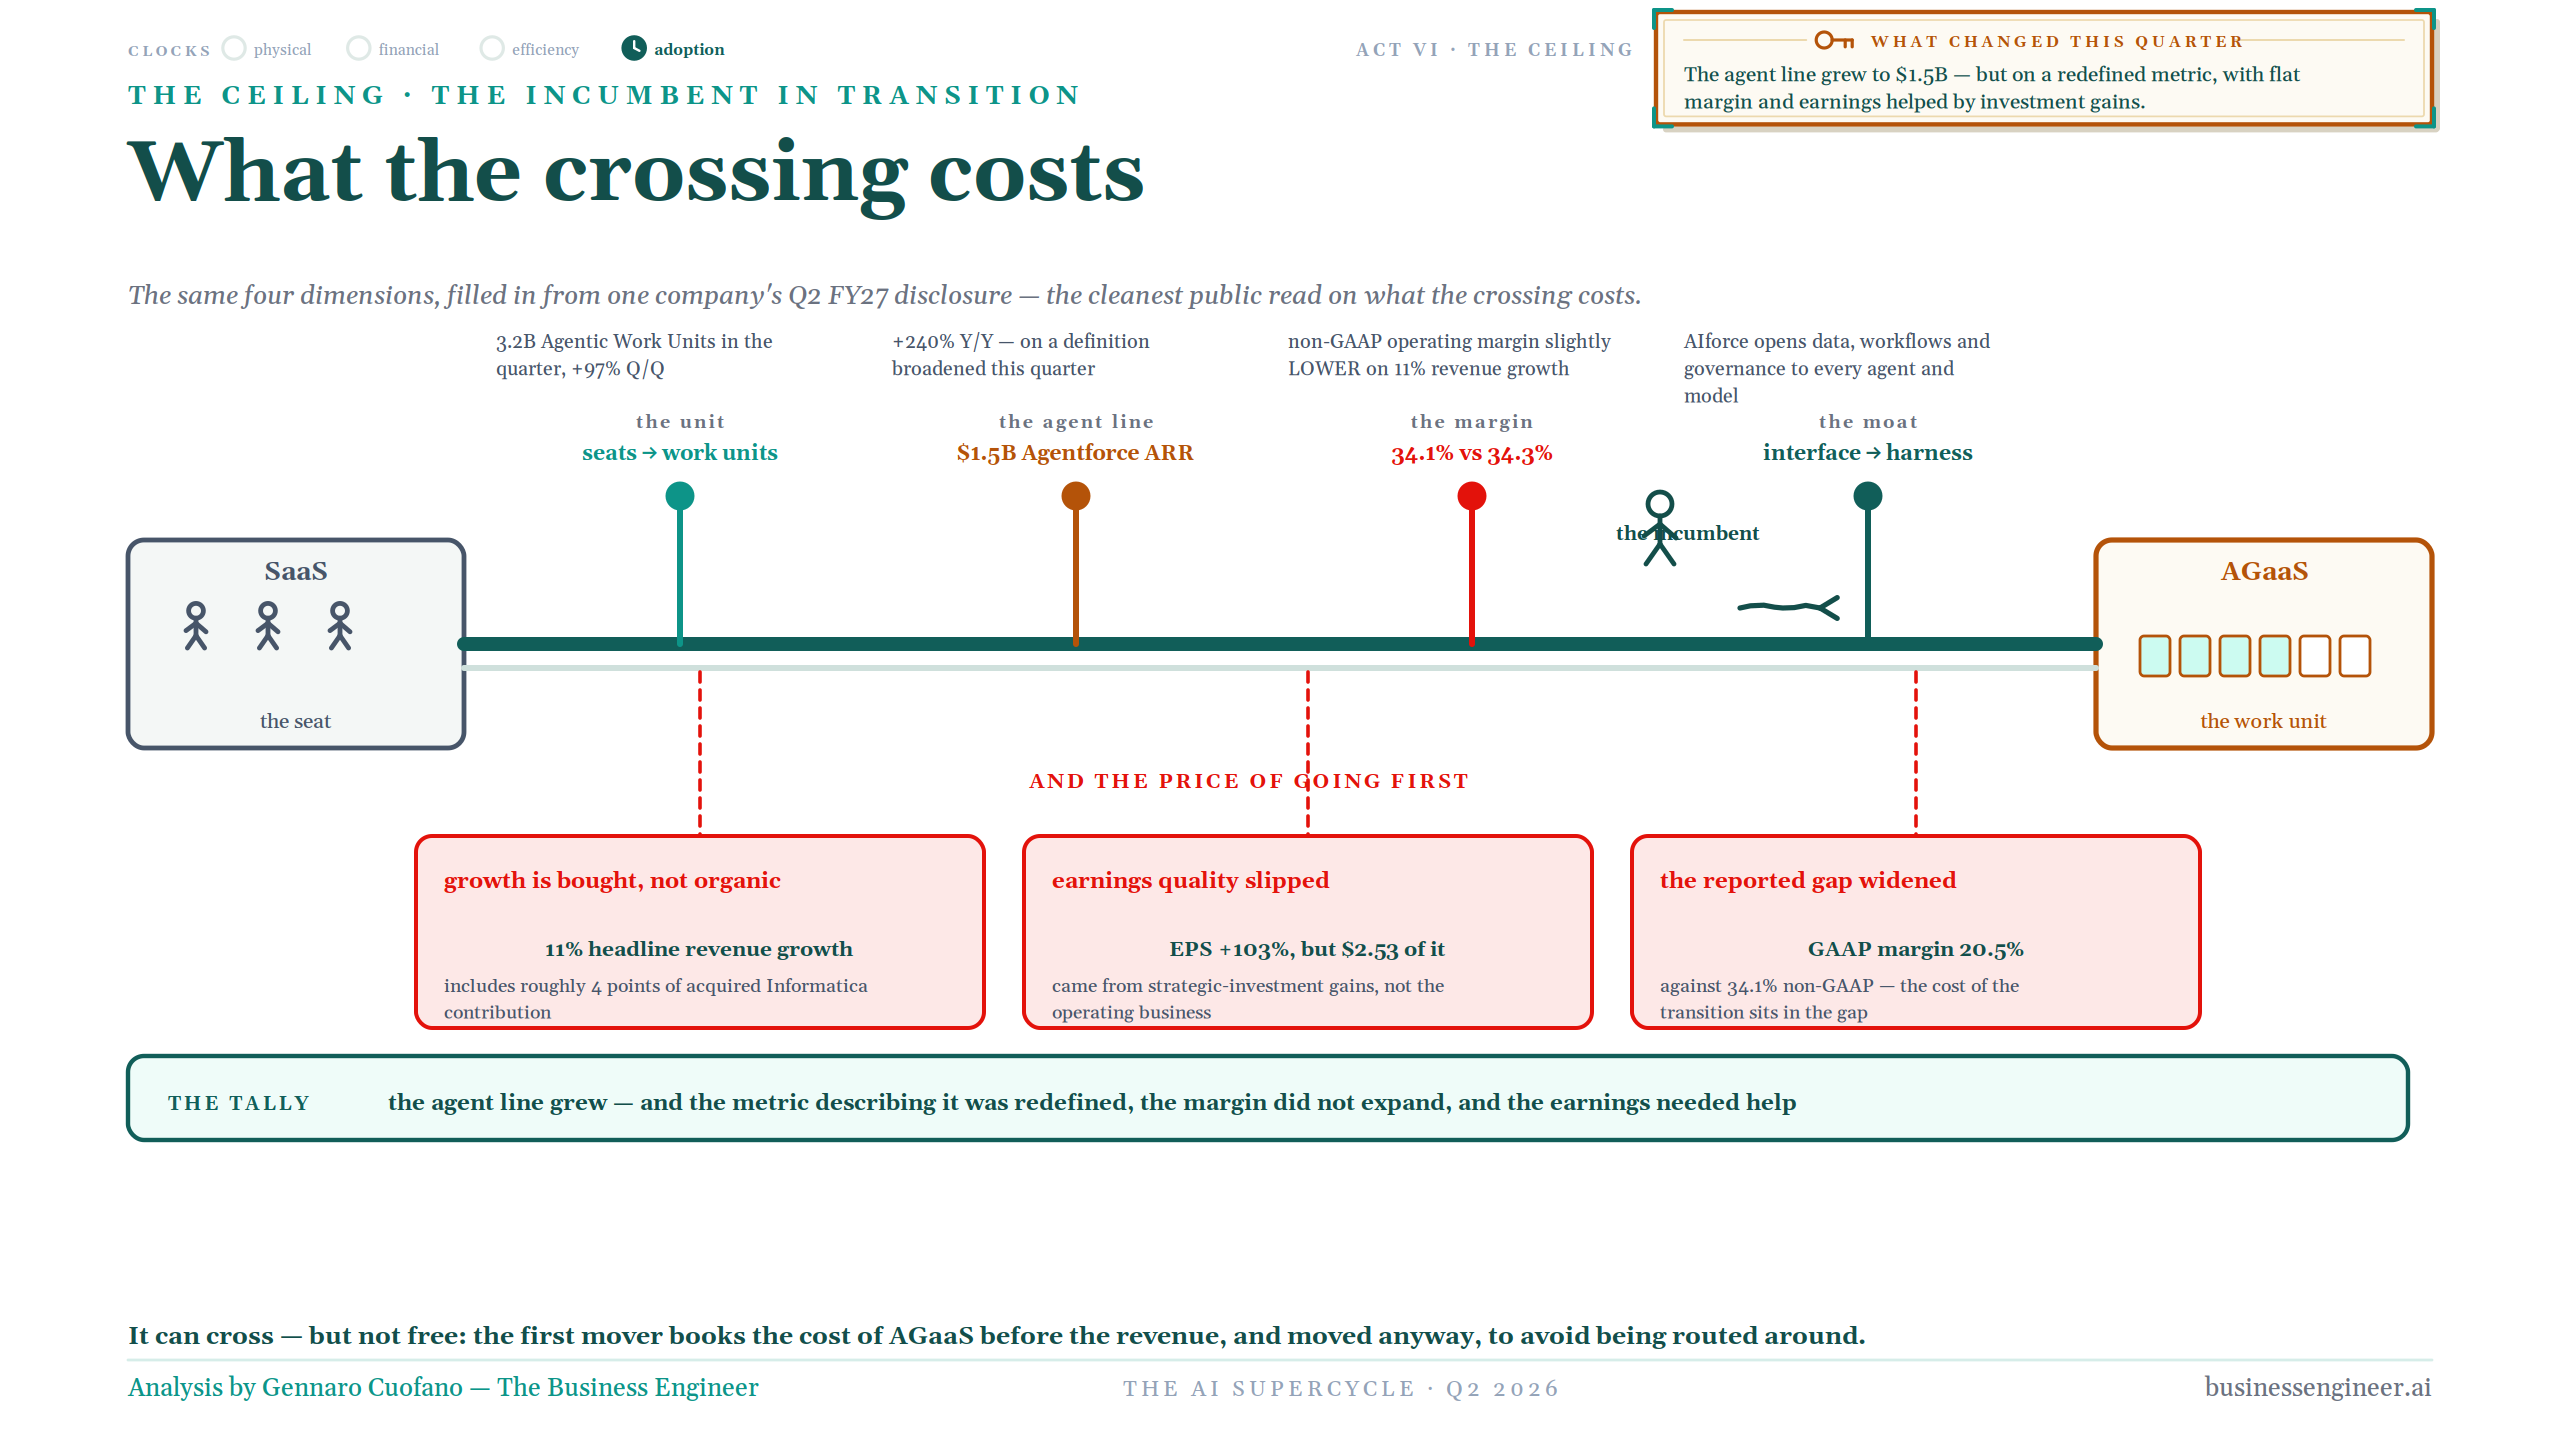
But incumbents do not get from SaaS to AGaaS for free. Salesforce is now giving us one of the clearest public views of what that transition actually costs.
Agentforce has reached $1.5 billion in annual recurring revenue, while usage is increasingly being measured through Agentic Work Units: 3.2 billion were delivered in the quarter, up 97% quarter over quarter, with 7.0 billion delivered to date. That is the opportunity. But the same numbers expose the transition underneath it. The unit of software is moving from the seat to the work performed, and that fundamentally changes the economics.
A SaaS seat had almost no marginal computational cost. An agentic action does. Every workflow executed by an agent can trigger models, tools, retrieval, memory and other infrastructure underneath it. The revenue becomes metered, but so does the cost. The incumbent therefore has to build a new revenue engine while absorbing inference into the P&L and rebuilding the product around a very different unit of consumption.
There is another cost: the interface itself becomes less defensible. Salesforce increasingly describes its value not as the screen the employee works inside, but as the trusted enterprise harness connecting data, workflows, logic, actions and governance to whatever agent or model sits above it. That is strategically sensible, but it represents a migration of the moat: from owning the human interface to owning the governed system underneath the agent.
And the $1.5 billion headline itself shows how messy the crossing can be. Salesforce broadened the definition of Agentforce ARR in the same quarter it reported more than 240% growth; under the previous definition, the figure would have been closer to $1.2 billion. The signal is therefore not simply that agentic revenue is exploding. It is that the old software categories are already becoming difficult to separate from the new ones.
That is what the crossing costs. The incumbent has to change the unit of monetization, absorb a new variable cost structure, reposition where its moat sits and reorganize the existing product around agents, all before the new economics are large enough to replace the old ones cleanly.
The first mover pays for the transition before it captures the full economics of the destination. But the alternative may be worse: defending the interface while the agent routes around it.
THE VERDICT
What Q2 actually settled
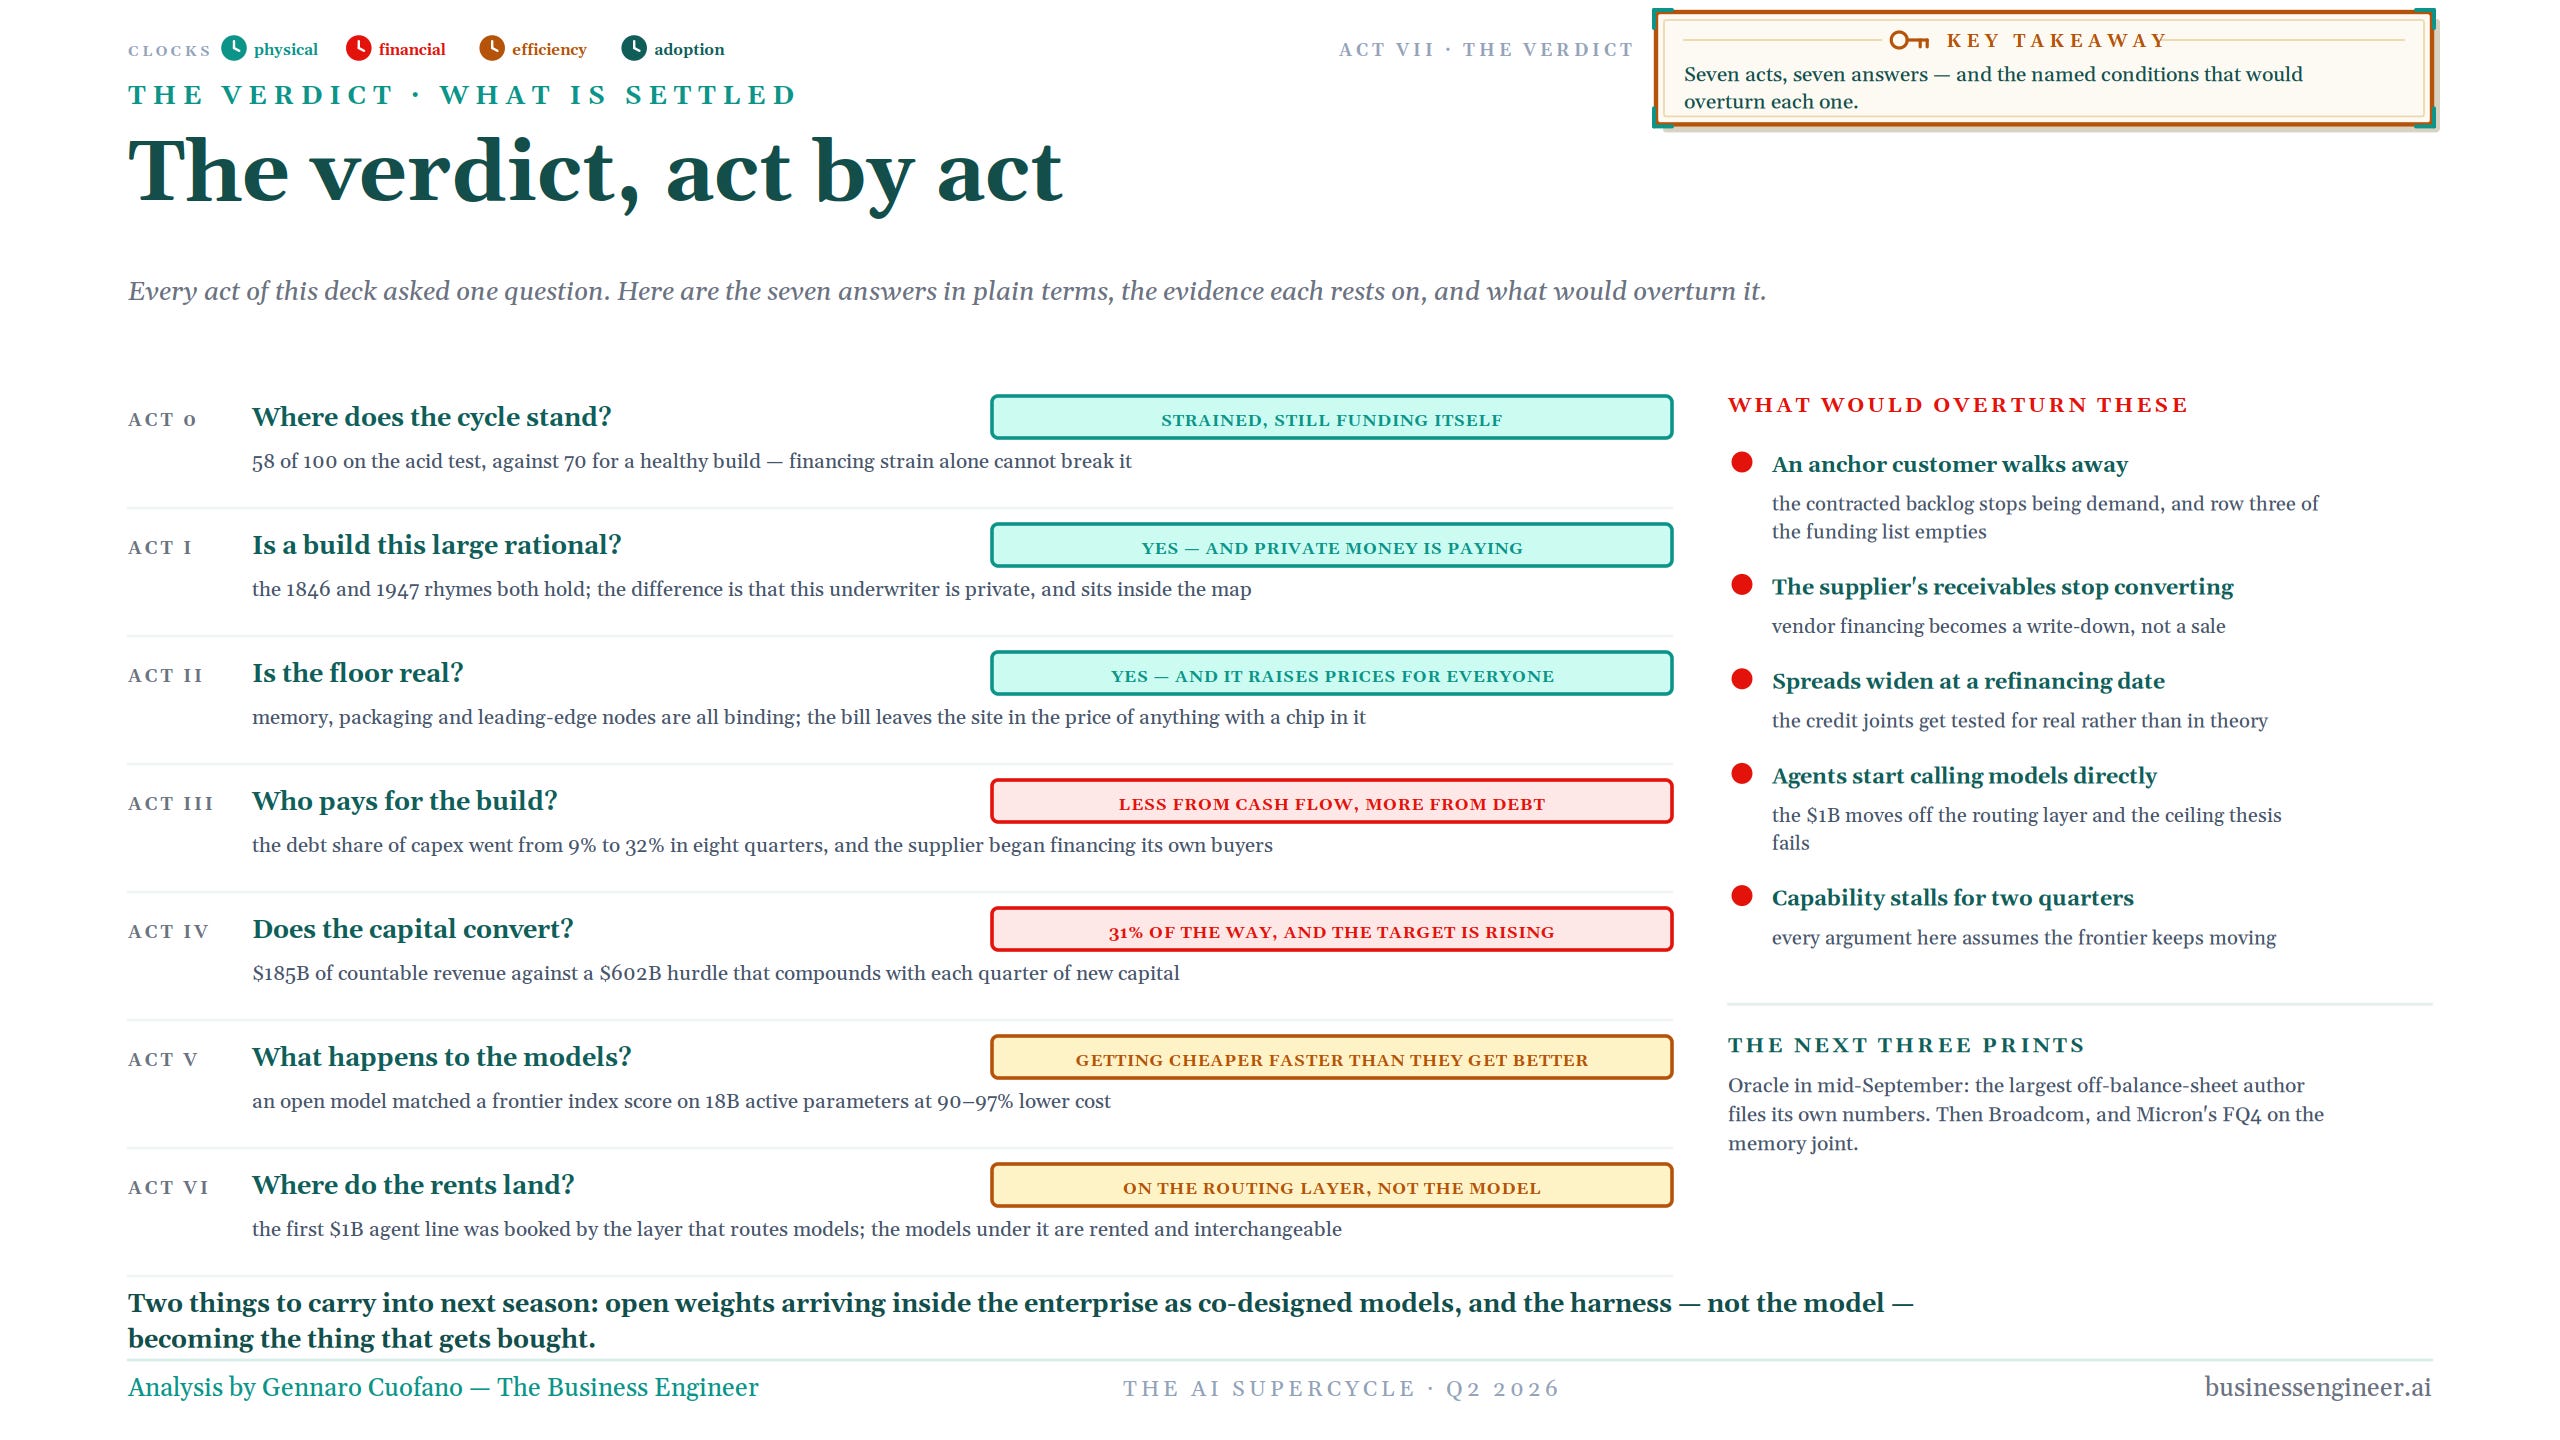
After going through every layer, the map can finally answer the questions it started with.
Where does the cycle stand? Strained, still funding itself. The financing composite reads 58/100. Financial pressure has risen substantially, but the available evidence does not yet show a generalized funding break.
Is a build this large rational? Potentially, but the most interesting development is that private capital is doing more of the underwriting. Both historical rhymes remain useful: the railway mania explains how infrastructure can survive the financiers that originally funded it, while the transistor explains how falling costs can expand demand dramatically. The variable that changed is the underwriter.
Is the physical floor real? Yes. Memory, advanced packaging, leading-edge fabrication, networking and power continue to show genuine constraints. But not every scarcity rent is a permanent moat.
Who pays for the build? Increasingly, not only the hyperscalers’ operating cash flow. Debt, leases, customer prepayments, take-or-pay structures and supplier financing are doing more of the work. Risk is not disappearing; it is migrating.
Does the capital convert into enough revenue? Partly. The framework currently identifies roughly $185 billion of end-customer AI revenue against a modeled $602 billion annual revenue hurdle for the capital already deployed. That is about 31% of the base-case hurdle, and the target continues rising as new infrastructure is installed.
What happens to models? The unit price of useful intelligence is falling rapidly while several physical inputs required to produce it remain scarce. Open weights, sparsity, distillation and inference optimization continue pushing down the cost of capability.
Where do the rents land above the model? The early evidence points toward the harness and routing layer. Agentforce has reached $1.5 billion of ARR, while Salesforce is increasingly monetizing the enterprise layer connecting models to data, workflows, tools and governance. The emerging thesis is straightforward: models can be rented; the layer that governs the work can be owned.
And there are explicit ways this analysis can be wrong. If anchor customers walk away, contracted backlog stops being a meaningful demand floor. If supplier receivables stop converting to cash, vendor financing changes from evidence of demand into evidence of credit risk. If spreads widen precisely when major borrowers refinance, the financial joints get tested for real. If enterprises bypass the harness and call models directly, the junction thesis weakens. And if capability improvement stalls for a sustained period while infrastructure commitments continue rising, a large part of the demand argument has to be revisited.
Those are falsifiers. Not vibes.
The next prints matter for specific reasons. Oracle will help test one of the most aggressive financing structures. Broadcom offers another read on custom silicon and the center of the compute build. Micron becomes a potential tripwire for the memory joint.
And two larger questions carry into the next season: whether open weights genuinely enter the enterprise as co-designed systems, and whether the harness, not the model, becomes the durable thing customers actually buy.
The compression
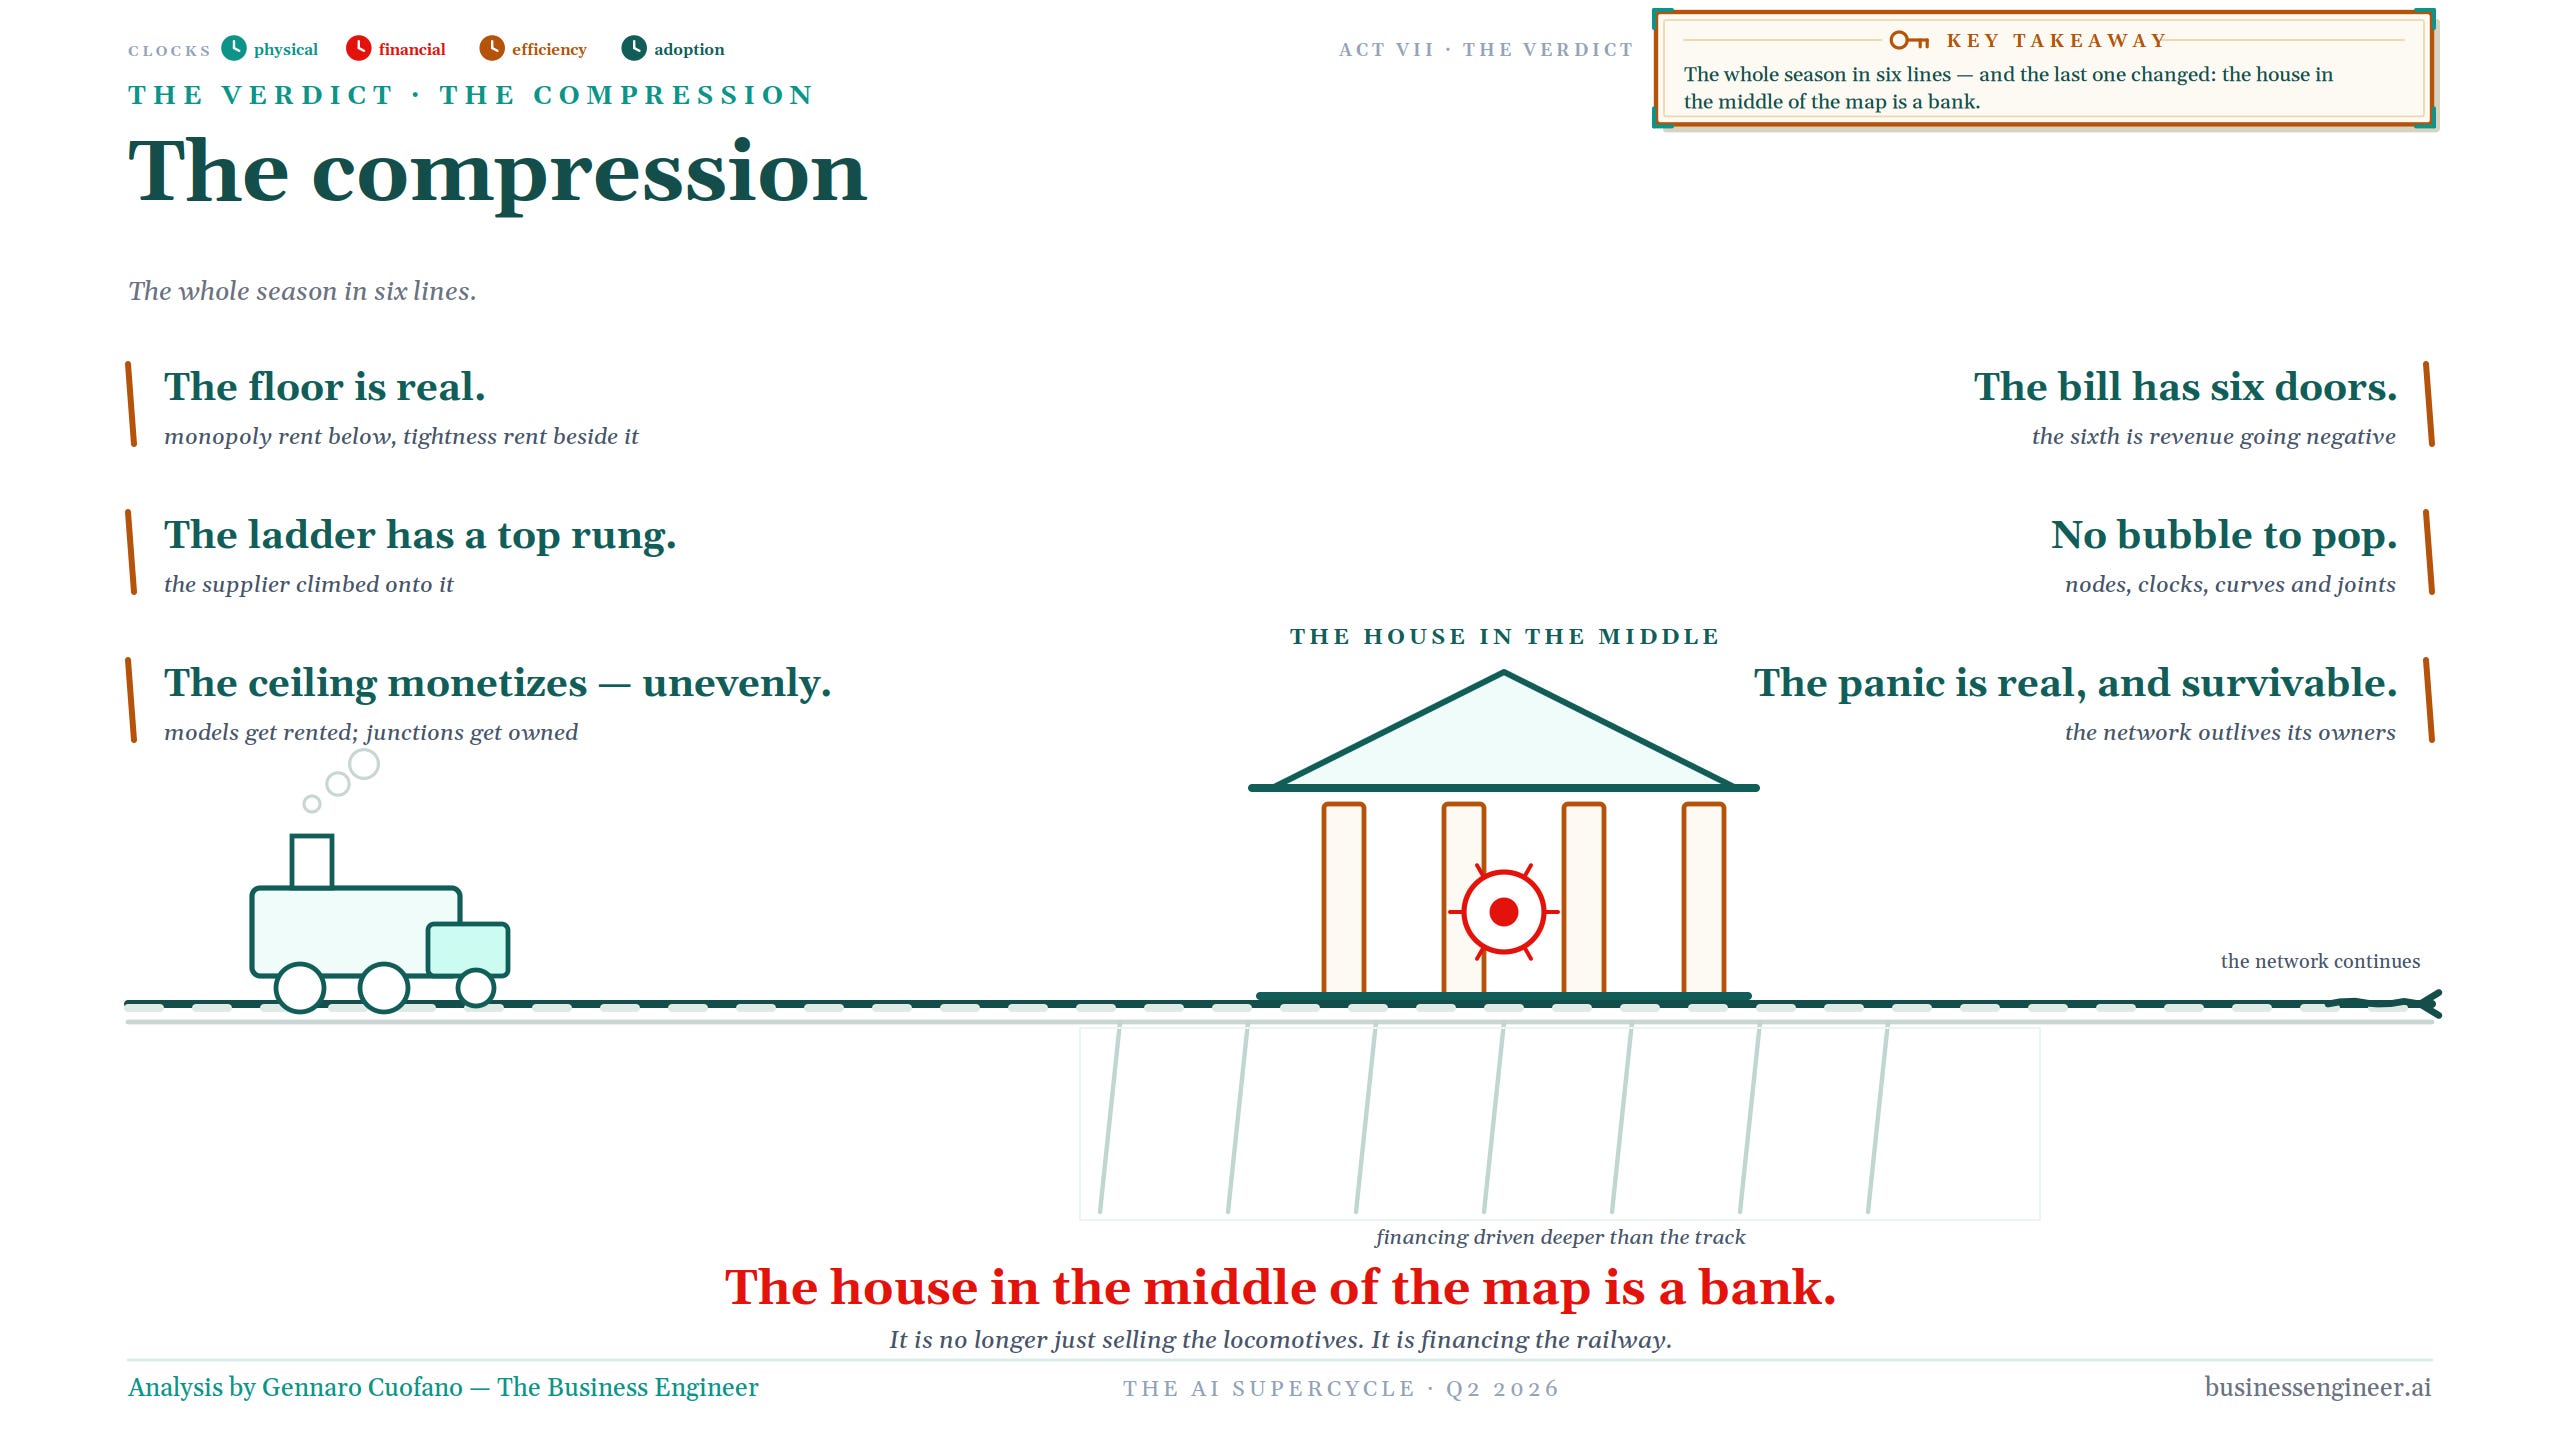
The Q2 map resolves into six conclusions.
First, the physical demand is real. ASML, TSMC, HBM, advanced packaging, networking and power are independently showing that the infrastructure required to run AI remains constrained. But not every company benefiting from that constraint has the same moat. ASML and TSMC sit behind capabilities that are extraordinarily difficult to reproduce. Some margins elsewhere may reflect temporary scarcity that eventually normalizes.
Second, the build is becoming more financially dependent. The largest hyperscalers can still fund much of their infrastructure from operating cash flow, but an increasing share of the system now relies on debt, leases, customer prepayments, take-or-pay contracts and supplier financing. That does not mean the structure is breaking. It means more of the risk is moving into counterparties, creditors and suppliers.
Third, NVIDIA is now part of that financing system. This is the most important change in the quarter. NVIDIA is no longer simply selling GPUs into the build. It is extending credit into the ecosystem, investing in companies tied to AI infrastructure demand and participating in structures that help support the power and capacity its hardware requires. The supplier is increasingly helping finance the market consuming its products.
Fourth, the infrastructure is monetizing, but monetization has not yet caught the modeled return hurdle. The framework counts roughly $185 billion of end-customer AI revenue against about $602 billion of annual revenue required to support the capital already deployed under the base-case assumptions. That means current monetization represents roughly 31% of the hurdle. AI revenue is real and growing quickly, but every new round of infrastructure spending raises the amount the application layer will eventually have to earn.
Fifth, the unit price of intelligence is falling while parts of the physical infrastructure remain scarce. Open weights, distillation, better architectures and inference optimization continue reducing the cost of useful capability even as memory, packaging, power and leading-edge fabrication remain constrained. That asymmetry pushes strategic value upward. Enterprises can increasingly rent the model underneath while seeking to own the context, workflows, permissions and orchestration around it.
Sixth, that is where the first meaningful application-layer revenue is beginning to appear. Agentforce has reached $1.5 billion of ARR, but the more important fact is what Salesforce is monetizing: the enterprise harness connecting models to data, workflows, tools and governance. The model underneath can change. The control layer remains.
Put those six observations together and the picture is more precise than either “AI is a bubble” or “AI will justify everything.”
The technology is real. The infrastructure demand is real. The monetization is real.
The financial excess can also be real.
Those facts can coexist.
Some infrastructure will almost certainly be overbuilt. Some companies will discover that temporary scarcity was not a permanent moat. Some borrowers may fail to refinance. Some model margins will compress. Some software products will lose revenue as agents route around their interfaces.
None of those outcomes necessarily means that the infrastructure itself disappears.
That is why the railway analogy remains useful. Britain overfinanced the railway build. Investors lost enormous amounts of money. Ownership changed hands. But the tracks remained because the underlying network had economic value.
AI can follow the same pattern.
The build can be transformative and financially mispriced at the same time.
And that brings us back to the most important discovery from NVIDIA’s Q2 print.
Until now, NVIDIA could largely be described as the company selling the critical equipment into the AI infrastructure boom. This quarter, that description stopped being sufficient. Its credit exposure to the ecosystem expanded, its investments around the build grew, and its role in supporting the surrounding infrastructure became increasingly visible.
So the conclusion is no longer merely metaphorical. It is structural:
NVIDIA is becoming both supplier and financier to the AI build.
Or, in the language of the railway analogy:
The company selling the locomotives is increasingly helping finance the railway.
How I built the map
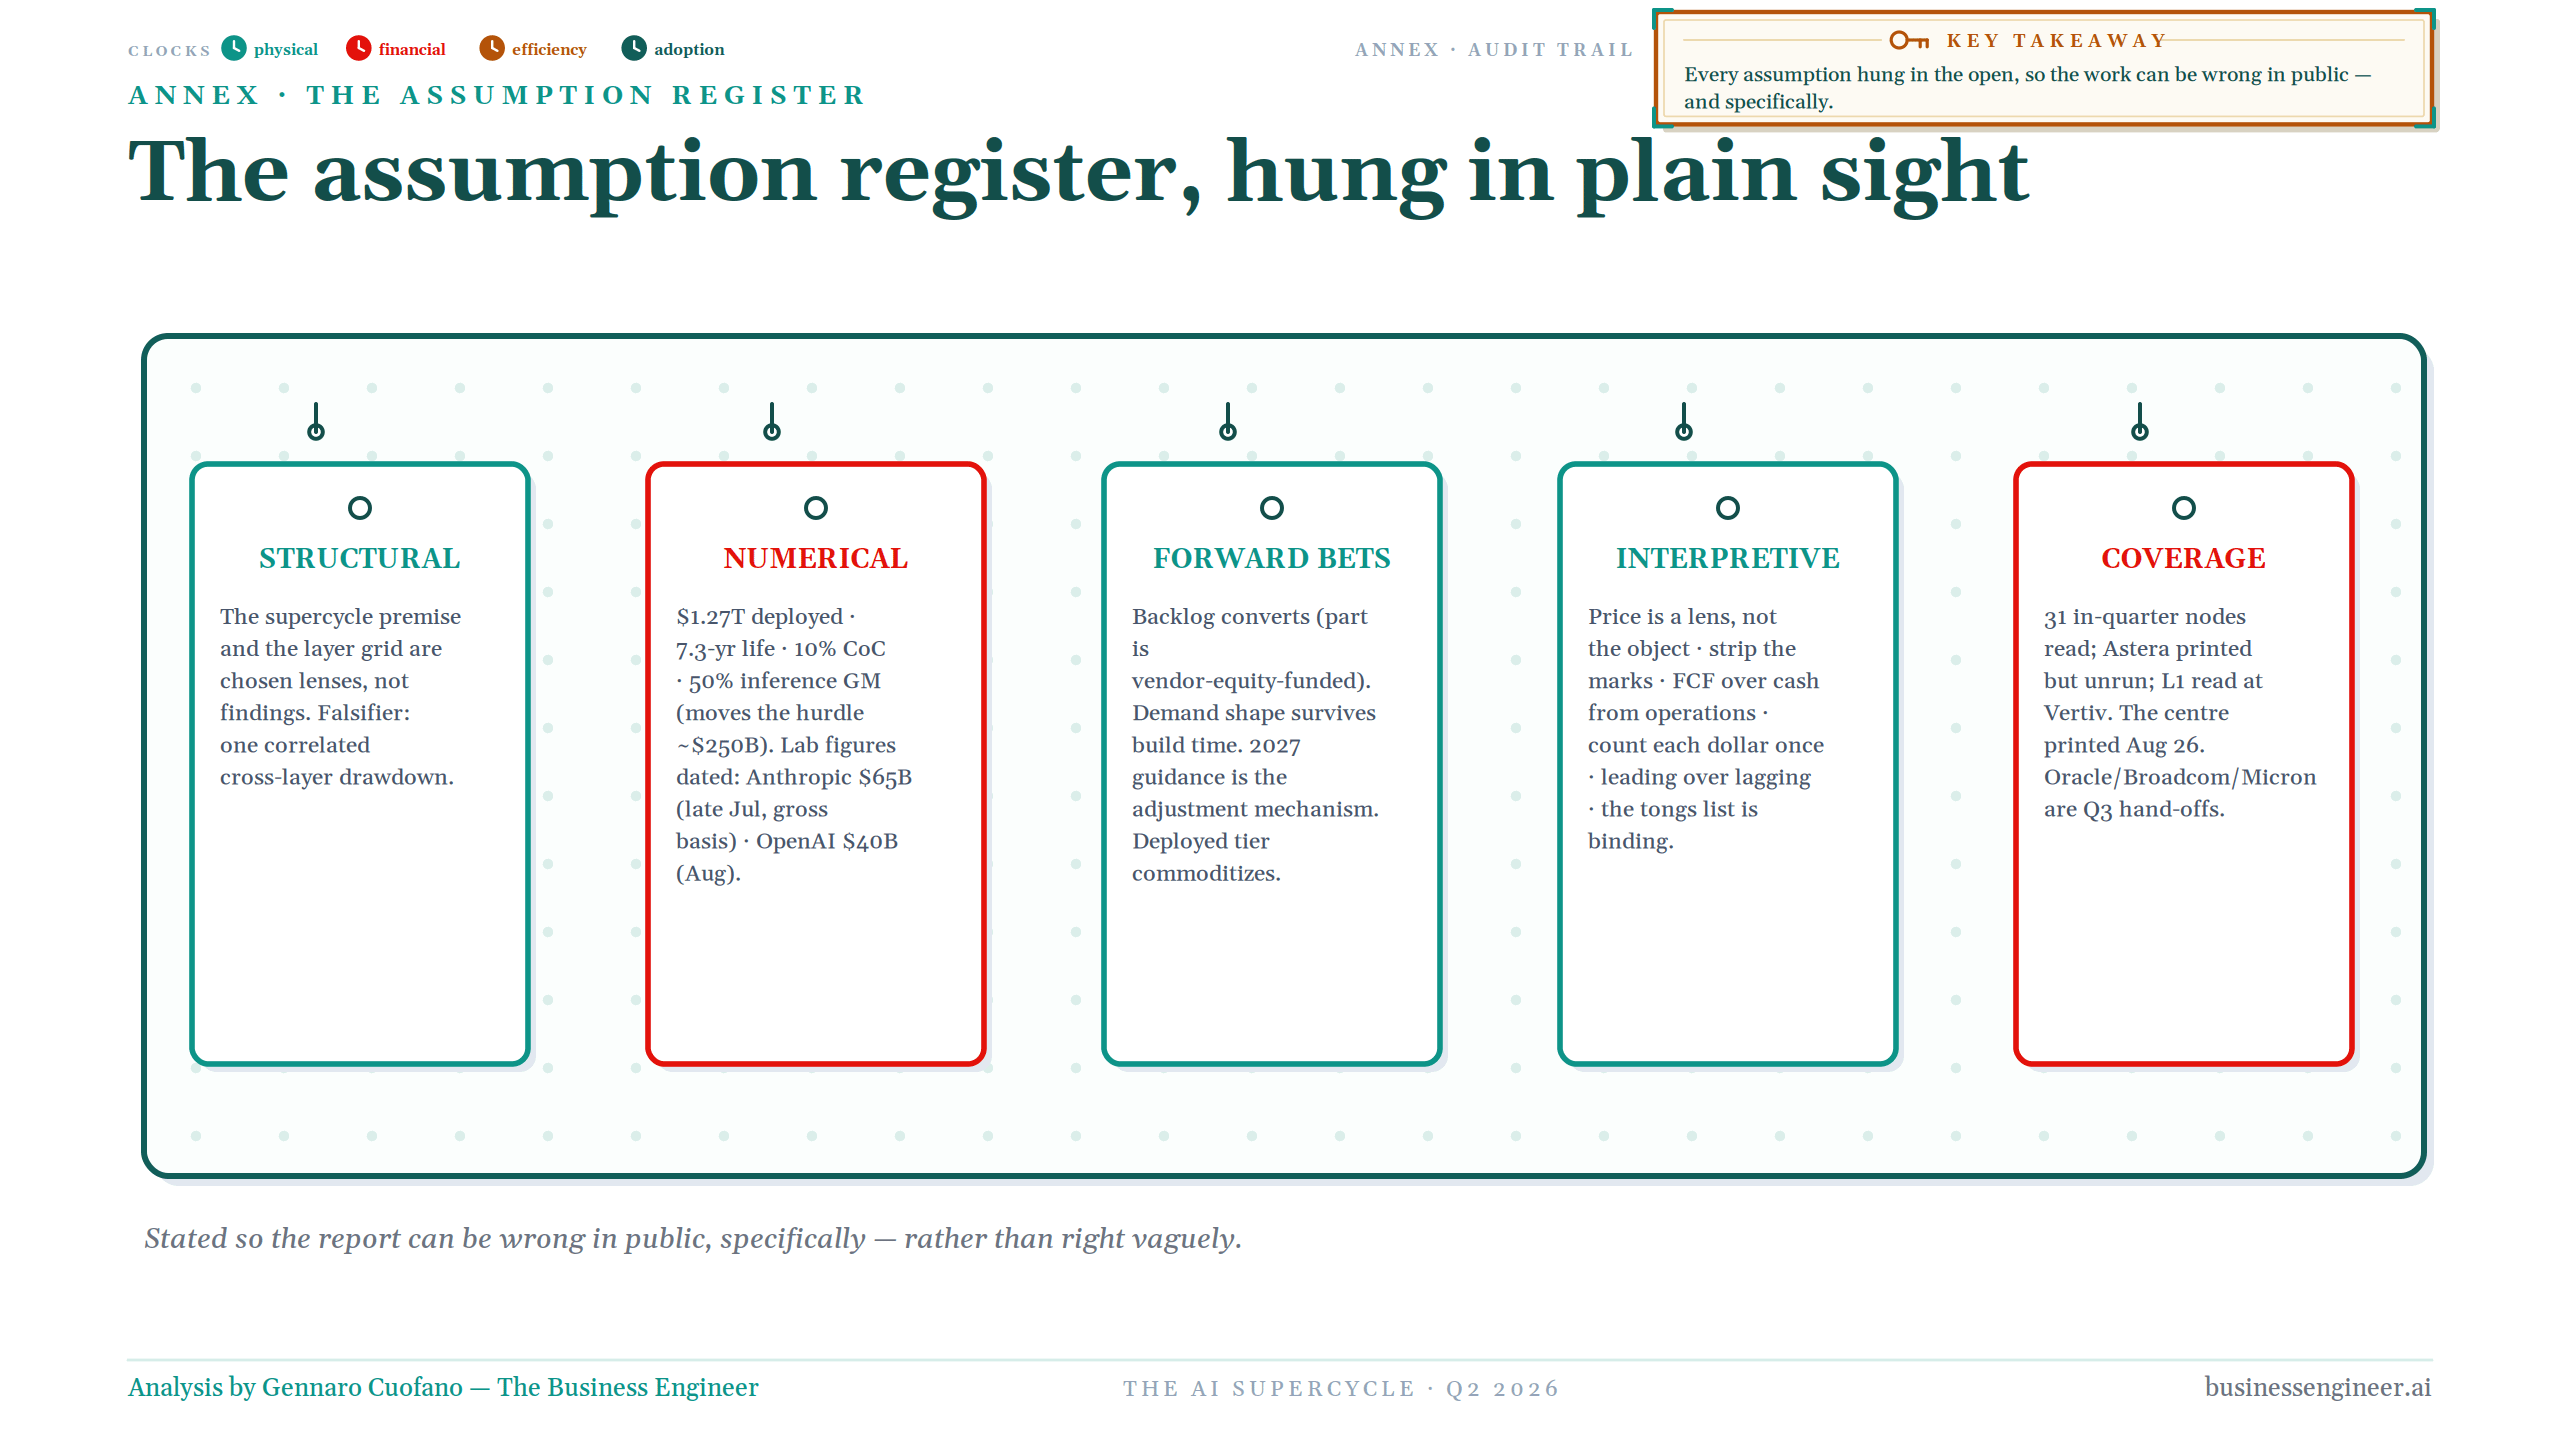
One final point matters: the framework is only useful if it can be challenged.
The map is built to make its assumptions visible. I separate structural assumptions from numerical assumptions, forward bets from interpretive judgments, and I record the areas where coverage is incomplete. The reason is simple: if an assumption turns out to be wrong, I want to know exactly which part of the analysis has to change.
The 58/100 reading works the same way. It is not one top-down judgment about the health of AI. It is a composite built from six separately defined financing gauges: 14, 48, 60, 67, 72 and 84. Equal weighting gives 57.5, rounded to 58.
Different weights would move the composite. Put more emphasis on cash coverage and the reading falls. Put more emphasis on structural leverage and financing velocity and it rises. That is acceptable because the composite is a summary, not a physical law.
The more important signal is the dispersion: there is roughly a 70-point gap between the least and most stressed readings. That tells us the system is not uniformly healthy or uniformly fragile. Different parts of the financing architecture are operating in very different regimes.
Each company is then analyzed using the same process. First, I place it on the stack so I know what question that company can actually answer. ASML tells me something about physical demand. CoreWeave tells me something about financing. Salesforce tells me something about application-layer monetization. No single company is allowed to answer the whole AI question.
Second, I read the company against the relevant clocks: physical, financial, efficiency and adoption. A semiconductor company and an enterprise-software company should not be evaluated with the same indicators because they sit in different parts of the system and move on different timelines.
Third, I force every print into one falsifiable conclusion. NVIDIA: Banked. Microsoft: Absorbed. CoreWeave: Refinanced. Salesforce: Conceded. The verb is useful because it makes the claim precise enough to test next quarter. If I cannot explain what changed in one clear statement, the analysis is probably not finished.
Fourth, I separate operating performance from financing and accounting effects. Investment marks are stripped out where possible. Free cash flow matters more than operating cash flow when the question is whether a company can actually absorb the build. And revenue is counted at the point where the end customer pays so that the same AI dollar is not counted repeatedly as it moves through the stack.
Finally, I distinguish leading indicators from reported financial results. Revenue and earnings tell us what has already happened. Alliances, customer commitments, talent movements, traffic changes, contract structures and changes in disclosure can tell us where the architecture may be moving before the revenue appears.
There is one discipline behind all of this:
State the hypothesis before the evidence arrives, and state in advance what would falsify it.
That is important because the purpose of The Map of AI is not to produce a framework that can explain every possible outcome after the fact. It is to build one that can fail clearly.
If demand across unrelated layers begins falling together, the supercycle thesis has to be revisited. If major contracted customers walk away, backlog can no longer be treated as a demand floor. If supplier receivables stop converting into cash, vendor financing changes from evidence of demand into evidence of credit risk. If enterprises bypass the harness and call models directly, the junction thesis weakens.
Those statements are useful because we can test them.
The goal is not to be vaguely right. It is to be specifically falsifiable.
That is ultimately what The Map of AI is for: a repeatable instrument for identifying where the AI system is strengthening, where risk is accumulating, and when the structure itself has genuinely changed.
With massive ♥️ Gennaro Cuofano, The Business Engineer